Download
1 / 33
330 likes | 436 Views
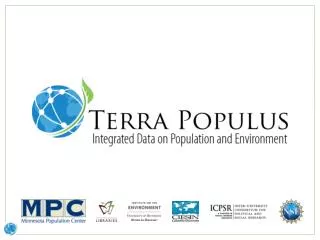
TerraPop aims to break silos, lower barriers, and enable interdisciplinary research by harmonizing population and environmental data worldwide. It offers tools to make disparate data formats interoperable, including microdata, area-level data, and raster data.

E N D
TerraPop Vision An organizational and technical framework to preserve, integrate, disseminate, and analyze global-scale spatiotemporal data describing population and the environment. • Develop tools to make data interoperable across data formats and subject areas • Break down disciplinary silos
TerraPop Goals Lowerbarriers to conducting interdisciplinary human-environment interactions research by making data with different formats from different scientific domains easily interoperable
Source Data Domains & Formats Population Microdata Area-Level Data
Making disparate data formats interoperable Microdata: Characteristics of individuals and households Area-level data:Characteristics of places defined by boundaries Raster data: Values tied to spatial coordinates
Age Birthplace Mother’s birthplace Sex Relationship Race Occupation Microdata Structure Geographic and housing characteristics Household record (shaded) followed by a person record for each member of the household For each type of record, columns correspond to specific variables
1973 Census Tapes arrive at Muller Media (New York) via Barcelona
The Power of Microdata • Customized measures: Variables based on combined characteristics of family and household members, capitalizing on the hierarchical structure of the data • Multivariate analysis: Analyze many individual, household, and community characteristics simultaneously • Interoperability: Harmonize data across time and space Age classification for school enrollment in published U.S. Census
Growth of Public-Use Microdata (number of person-records available) We are Here
IPUMS-International Microdata Over 100 Collaborating National Statistical Agencies
Area Level (Vector) Data Describing characteristics of geographic polygons Median Household Income by Census Tract
Area-level Data Sources • Census tables, especially where microdata is unavailable • Other types of surveys, data • Agricultural surveys • Economic surveys, data • Election data • Disease data • Legal/policy information • Environmental policy • Social policy • Human rights
Raster Data Represented as pixels in a grid Mean Precipitation
Raster Data • Beta system • Global Land Cover 2000 • Harvested Area and Yield for 175 crops (Global Landscapes Initiative) • Temperature and precipitation (WorldClim) • Future additions • Additional LU/LC and climate datasets • Elevation • Vegetation characteristics • Bioclimatic & ecologic zones
Location-Based Integration Microdata Area-level Raster
Location-Based Integration Microdata Mix and match variables originating in any of the data structures Obtain output in the data structure most useful to you Area-level data Rasters
Location-Based Integration Microdata Individuals and households with their environmental and social context Area-level data Rasters
Location-Based Integration Microdata Summarized environmental and population characteristics for administrative districts Area-level data Rasters
Location-Based Integration Microdata Rasters of population and environment data Area-level data Rasters
Rasterization • Beta system – Uniform distribution assumption • Use lowest level units available • Rates – same value for all cells in unit • Counts – evenly distributed across cells in unit • Future – Distribute based on ancillary data • Requires research on available methods • May provide as service – users select: • Ancillary data • Weights • Spatial distribution parameters
General Workflow • Browse variables and metadata • Select variables and datasets • View data cart contents • Select output options