Download
1 / 30
300 likes | 646 Views
The Potential Technifilter Plus Add-On tool using Bollinger Bands. Technifilter Plus Methodologies Based on the book Bollinger on Bollinger Bands. Disclaimer. Brightspark does not have any knowledge of the investment needs or objectives of individual attendees/viewers of this presentation.

E N D
The PotentialTechnifilter Plus Add-On tool using Bollinger Bands Technifilter Plus Methodologies Based on the book Bollinger on Bollinger Bands
Disclaimer Brightsparkdoes not have any knowledge of the investment needs or objectives of individual attendees/viewers of this presentation. ThisDemonstration represents suggestions, training and information for attendees/viewers to usewhen evaluatingand making investment decisions in light of their own individual investment goals and does not constitute specific advice. Technifilter Plus and/or (Stage Analysis, Potential, Market Report)does not take into account the Investment Objectives, financial situation and particular needs of any particular person, and before making an investment decision on the basis of Technifilter Plus and/or (Stage Analysis, Potential, Market Report), a prospective investor needs to consider, with or without the assistance of a Securities Advisor, whether the advice is appropriate in light of the particular investment needs, objectives and financial circumstances of the prospective investor.
The Potential The Potential is an easy to use Add-On Tool for Technifilter Plus, based on some of the methodologies and formulas discussed in John Bollinger’s excellent book Bollinger on Bollinger Bands. Using the power of Technifilter Plus’s Filtering and Automation capabilities, the Potential can be used to locate and monitor lists of stocks in a Squeeze and identify the breakouts. This includes maintaining the lists as well. It can locate “Break outs” using Trend following methodology… All of this at the click of a single button!!
Introduction • General Market Concepts • Bollinger Bands & Indicators • Bollinger Based Indicators: Bandwidth and %B • Trading systems: Breakout, Trend following and Trend Reversals • Sample Filtering and creating watch lists
Bollinger Bands - Summary Bollinger Bands are a powerful tool for trading almost any market, that uses Statistical probability, to identify high and low volatility. This gives traders a unique indicator, that can be used with other indicators, to formulate a robust and flexible trading approach, using multiple time frames.
Trading Effectively – Requires?? • We understand the type of Market we are in • We have a Trading Plan to match • We backtest and verify the trading system • We strictly implement our trading rules • We don’t try and buck the trend….
Going against the trend - costs money • The Majority of people keep doing the same thing over and over again…… or repeating the same mistakes over and over again… • Any Strong Bull trend following system, will NOT generate the same profits in both Bull & Bear Markets • We need to adapt to the type of Market conditions that are in place
Developed in 1983 by John Bollinger Construction: a 20 period simple moving average of the closing price Upper band 2 x Standard deviations above MA Lower Band 2 x Standard deviations below MA Default settings contain 88-89% of price action in most markets Bands are a combination of Trend following and Price Volatility Bollinger Bands- Summary
Bands Contract and Expand based on the volatility of the price action. Low Volatility - the bands contract or Tighten High Volatility - the bands expand High Volatility generally follows low volatility The Upper and Lower bands tend to identify extreme highs and lows or relative Highs and Lows Price can walk up or down the !!!!!!!bands Bollinger Bands - Characteristics
Bollinger Bands can be used with different time frames: Long (Eg. Monthly) Medium (Eg. Weekly) Short (Eg. Daily) Or Intra Day Weekly Daily Monthly Bollinger Band – Time frames
Bollinger Bands • The Moving average can be varied as can the Standard Deviations • Options: • MA Std Deviation • 20 2 (default) • 10 1.9 • 50 2.1
Bollinger Bands – Popular Misconceptions A Tag of the upper or Lower Band is not necessarily a negative signal. In fact it can often be a powerful Entry signal
Bandwidth Indicator that can be used to detect extremes:E.g. low or high volatility %B Indicator that can be used to identify “tags” or breaks of the upper, middle and lower bands Bollinger Band Indicators The width of the upper and lower bands and the position of price in relation to the bands gives a “definite” or “fixed” set of parameters that can be used to design robust Trading systems
Calculates where the current closing price is in relation to the Bands Formula: (Close – Lower BB) / (Upper BB – Lower BB) %B = 1.0 Close = Upper Band (Tagging Upper Band) %B = 0.0 Close = Lower Band (Tagging Lower Band) %B = 0.5 Close = Middle Band %B = 1.1 Close is 10% above the upper Band %B = -0.10 Close is 10% below the lower Band Bollinger Band Indicators – %B
Calculates the width of the Bollinger bands (used in quantifying the “Bollinger Band Squeeze”) Formula: (Upper BB - lower BB) / middle BB A Handy indicator for identifying LOW Volatility (a pre-cursor to High Volatility or the start of a new trend). It can also be used to identify the end of a trend when the upper or low band reverses and changes direction. Bollinger Band Indicators – Band Width
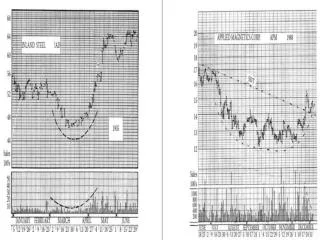
Locate Bands that are at their narrowest for the last 6 months. Using Bandwidth it is a simple process to scan and locate issues in a SQUEEZE Bollinger Bands – Squeeze using Band Width
After a large expansion in the bands a reversal of direction in the lower band can indicate the end of that leg of the move… Opposite is true for down trends as well Bollinger Band Width – End of a Trend
To help predict and confirm the direction of price action … Volume Based Indicators can be used to confirm Bollinger Band readings Indicators like: OBV – On balance volume ADI – Accumulation Distribution MFI – Money Flow Index II - Intraday Intensity Bollinger Bands and Volume Indicators Indicators used should be totally independent of each other
Locate the lowest low in the Bollinger Bandwidth over the last 6 months = “the Squeeze” Entry can be the Breakout orBreakdown Watch out for “false breakouts” Bollinger band Volatilty Breakout Trading System 6 months
Create a watch list of stocks currently in the “Squeeze” Monitor Stocks for volume indicator confirmation (MFI, Intraday Intensity, OBV signals / confirmation, etc.) Be ready for quick action, when resistance or support is broken. Bollinger Band - Breakout from “the Squeeze” Tips
Breakout from a Squeeze Possible Stop Loss/Trailing Stops methodologies: Parabolic SAR or ATR 3 The Bottom band can also be used Bollinger band Volatilty Breakout Trading System - Long
Breakout from a Squeeze Possible Stop Loss/Trailing Stops methodologies: Parabolic SAR or ATR 3 The Bottom band can also be used Bollinger band Volatilty Breakout Trading System Short
Buy Signal %B greater than .8 MFI greater than 80 Possible Stop Loss/Trailing Stops methodologies: Parabolic SAR or ATR 3 The Bottom band can also be used Bollinger band Trend Following System - Long
Sell Signal %B less than .2 MFI less than 20 Possible Stop Loss/Trailing Stops methodologies: Parabolic SAR or ATR 3 Bollinger band Trend Following System - Short
Use %B to locate Price Tags of the Lower Band, with a Volume Indicator like II% giving a divergent positive signal Bollinger band Trend Reversal System - Long
Use %B to locate Price Tags of the Upper Band, with a Volume Indicator like II% giving a divergent negative signal Bollinger band Trend Reversal System - Short
To Summarise • Bollinger Bands give the trader an insight as to whether a price is “relatively” High or Low. • Using the %B and/or Bandwidth Indicators a very robust set of trading rules can be implemented and back tested • Bollinger Bands can be incorporated into other trading systems
The Potential – Easy to use Menu Driven..Type in your Selection Run a Scan View the Report View the Charts
The EndCharts and Filter scans – Technifilter PlusReferences: Bollinger on Bollinger Bandswww.bollingeronbollingerbands.comvisit our web site for more details:http://www.technifilter.comemail: sales@technifilter.com