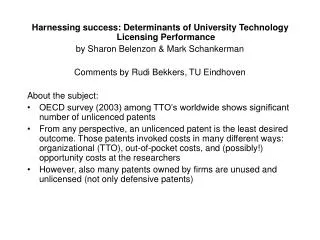
Technology Licensing at Stanford University
Technology Licensing at Stanford University Overview Background and Policies OTL Facts and Figures OTL Process: Invention to License University-Industry Technology Transfer Mechanisms Graduated students Publications Seminars, conferences, etc. Faculty consulting

Technology Licensing at Stanford University
E N D
Presentation Transcript
Overview • Background and Policies • OTL Facts and Figures • OTL Process: Invention to License
University-Industry Technology Transfer Mechanisms Graduated students Publications Seminars, conferences, etc. Faculty consulting Industry sponsored research Industrial affiliate programs Intellectual property licensing Start-up companies and large corporations Research results from lab New products in marketplace Intellectual Property Licensing
University-Government Interactions Bayh-Dole Act Created uniform patent policy regarding inventions made under federally-funded research programs Encouraged universities to participate in technology transfer activities Government University
Bayh-Dole Act (U.S. Public Law 96-517) • University may elect to retain title to inventions developed under federally-funded research programs • University grants royalty-free nonexclusive license to government • Any company holding an exclusive license must substantially manufacture the product in the U.S. • In marketing of an invention, University must give preference to small business firms (< 500 employees) • University must share with the inventor(s) a portion of any revenue received from licensing (Sources: COGR Publication “The Bayh-Dole Act: A Guide to the Law and Implementing Regulations”,37 CFR Part 401, 35 USC 200-212)
Stanford Facts for 2008 • 7 Schools • Business, Earth Sciences, Education, Engineering, Humanities and Sciences, Law, and Medicine • 1,829 Faculty members • Students (6,759 undergraduate and 8,186 graduate) • Finances (FY 2007-2008) • $3.4 billion budget • $1.06 billion in sponsored research, including SLAC (87% by federal government sponsors) • additional $132.1 million in part through 55 industrial affiliate programs • $17.2 billion endowment (http://www.stanford.edu/home/stanford/facts/)
Office of Technology Licensing (OTL) Mission To promote the transfer of Stanford technology for society’s use and benefit while generating unrestricted income to support research and education. Technology Transfer Portfolio Patents Copyrightable Material Software Biological Material Semiconductor Maskworks
Licensing: Inventions to New Products OTL decides IP protection for invention and markets invention broadly Federal & industry research money OTL licenses invention to Company Additional research funding Company pays royalties to University
Stanford’s Intellectual Property Policy • Patentable TechnologyUniversity takes title to all inventions created with more than incidental use of University resources www.stanford.edu/dept/DoR/rph/5-1.html • Copyrighted WorksUniversity takes title to copyrightable works created with significant University resourceswww.stanford.edu/dept/DoR/rph/5-2.html • SU-18 Patent and Copyright Agreementwww.stanford.edu/dept/DoR/rph/su18.html
Stanford’s Royalty Distribution Policy • Cash Royalties from Issue, Minimums, Earneds • Net Royalties = Cash Royalties minus 15% for administrative expenses minus out-of-pocket expenses (e.g. patent costs)
OTL: Notable Stanford Inventions 1970 – OTL Established 1971 – FM Sound Synthesis ($22.9M) 1974 – Recombinant DNA ($255M) 1981 – Phycobiliproteins ($46.4M), Fiber Optic Amplifier ($40M), MINOS ($3.8M) 1982 – Amplification of Genes ($30M) 1984 – Functional Antibodies ($191M) 1986 – CHEF Electrophoresis ($2.25M) 1990-1992 – Discrete Multi-tone technologies for DSL ($29M) 1996 – Improved Hypertext Searching - GoogleTM ($337M) 2009 – the next big thing ???
OTL: Disclosure and Licensing History 1970 28 3 $50,000 2 Cumulative 7500 2800 $1.2 B Disclosures Licenses* Royalty Income Staff * Majority of disclosures are never licensed; many disclosures have one license; some disclosures have multiple licenses 2008 430 107 $62.5 M 30 Active ~3000 ~1000
OTL: The Upside • In FY07-08, $62.5 million in royalties • From 1970 through 2008, ~$1.2 billion cumulative royalties • Typically, 10 to 15 years may elapse between initial invention disclosure and any significant royalties
OTL: Looking Closely at Royalties • In FY07-08, $62.5 million from 546 disclosures • 33 out of 546 disclosures generated over $100,000 each • 3 out of 33 generated over $1 million each • From 1970 through 2008 • 58 inventions generated $1 million or more • 3 out of 7500 is BIG WINNER • Royalties from large portfolio of inventions
OTL: Conversion Numbers ~8 disclosures received per week ~ 50% of disclosures are filed as patent applications some disclosures potentially licensable as copyright or biological materials 20 - 25% of disclosures, including those patented, are licensed
OTL: Revenue vs. Expenses • OTL is self-supporting • 15% of revenue > operating expenses • Operating budget of ~$4.8 million/year • Patent expenses of ~$8.1 million/year • OTL has given ~$43.5 million to Research Incentive Fund administered by Dean of Research
OTL: Equity from Licenses • Stanford’s philosophy • Equity is one component of a whole financial package • Historically, most income is generated from earned royalties (~$836 M vs. ~$364 M) • Equity is liquidated soon after IPO • We can’t hold equity if licensee conducts clinical trials here • Equity from licenses • ~171 companies cumulative • ~90 companies currently • Equity liquidated to date ~$364 million
Equity Cash-Out at Stanford* • Equity distribution • 15% to OTL • 1/3 of net equity to inventors • 2/3 of net equity to OTL Research and Fellowship Fund • Equity liquidated to date ~$364 million • Amati (Texas Instruments) $8.0 million • Abrizio (PMC-Sierra) $9.7 million • Google™ $336 million *Graph does not include liquidation of GoogleTM equity in FY04-05
OTL: Invention to License • Steps • Disclosure • Evaluation • Licensing Strategy • File patent? • Market to potential licensees • The License • Maintaining the Relationship • 7 “Licensing Associate & Licensing Liaison” teams • Technical degrees and marketing focus • Responsibility for inventions from cradle-to-grave
Evaluation Discuss with inventors Inventor provides technical expertise Inventor may also provide industry contacts Discuss with others at OTL Contact industry experts Typical criteria Invention development status Inventor profile Intellectual property position Commercial potential Licensing potential The Main Question Does it have the potential to create meaningful income for the University?
Licensing Strategy • A license is a legal document regarding intellectual property rights in exchange for good and valuable consideration. • Different inventions require different licensing strategies • “ basic new scientific tool” vs. “invention requiring extensive development” • electronics industry vs. biotech industry IP rights Licensor Licensee royalties
Patenting Decision • Can we license as tangible research property (TRP)? • Can we license as it as copyright? • Is it patentable and enforceable? • Has it been publicly disclosed?
Patent Prosecution • Licensing professional manages outside counsel • Technology expertise • Patent agent vs. Patent attorney • Patent costs • Typically $25,000 to $35,000 over life of U.S. patent • USPTO fees • if invention is not licensed, pay small entity fees • Patent attorney/agent costs • Higher patent costs for foreign coverage • PCT application preserves foreign rights while delaying costs • National phase entry if licensee reimburses costs
Marketing Strategy • When do we start? • Waiting for publication • Waiting for data • Individual vs. Portfolio • Contact companies and provide information • Shotgun vs. Rifle approach • Sources of leads • Steps • Create marketing content • Create list of potential licensees • Contact potential licensees • Follow-up
Types of License Agreements • Option agreement • Non-exclusive agreement • Exclusive agreement • Limited by Field of Use • Limited Period of Time (e.g. earlier of 8 years from Effective Date or 5 years from first commercial sale)
Key License Terms Financial terms License issue fee Annual minimum payments Earned royalties % of Net Sales $ per product sold Reimbursement of patent costs Equity in start-up companies Non-financial terms Definitions Grant Development milestones & diligence provisions Prototype First Commercial Sale Warranties and indemnities Infringement actions Dispute resolution
Licensing: Inventions to New Products OTL decides IP protection for invention and markets invention broadly Federal & industry research money OTL licenses invention to Company Additional research funding Company pays royalties to University