Download
1 / 15
150 likes | 276 Views
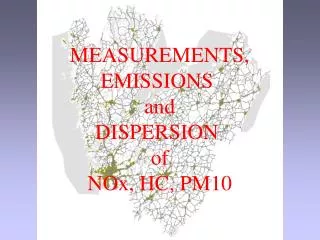
Measurements of PM10 a contribution from EIONET. Roel van Aalst Steinar Larssen. Level All EMEP sites, start now, time resolution 24h 5-10 EMEP sites, start 2002 +) , time resolution 24h Research projects, campaigns, higher time resolution (< 2-3 h). EMEP particulates programme.

E N D
Measurements of PM10a contribution from EIONET Roel van Aalst Steinar Larssen
Level All EMEP sites, start now, time resolution 24h 5-10 EMEP sites, start 2002+), time resolution 24h Research projects, campaigns, higher time resolution (< 2-3 h) EMEP particulates programme
PM10 CEN 12341 level 1 PM2.5 CEN 2.5 level 1 PM1.0level 1 Number size distribution level 3 plus an extensive programme of chemical measurements EMEP particulates programme
Urban and local stations are not in the EMEP programme These are needed for health impact assessment as foreseen in the CLRTAP. This could be an obvious contribution of EIONET to the EMEP programme. Needs
Station type N >=3 y >=5 y rural background 35 8 0 urban background 130 30 14 traffic 129 17 1 industry 21 3 1 unknown 20 0 0 Total 335 58 16 Hourly pm10 data in AIRBASE
PM10 concentrations go down PM10 all stations >2 full years 10 5 0 change (%/y) 0 10 20 30 40 50 60 -5 -10 -15
PM10 concentrations go down PM10 all stations >2 full years 15 10 5 0 -15 -10 -5 0 change (%/y)