Download
1 / 16
180 likes | 777 Views
The contribution from photoluminescence (PL). Gordon Davies, King’s College London. A short introduction to photoluminescence (PL). Excite the sample with light (‘photo’); some of the energy is emitted as light (‘luminescence’).

E N D
The contribution from photoluminescence (PL) Gordon Davies, King’s College London
A short introduction to photoluminescence (PL). Excite the sample with light (‘photo’); some of the energy is emitted as light (‘luminescence’). Excitation is usually by a laser, for convenience of directed beam, with beam power of 100’s of mW. Green laser light is absorbed by the crystal, exciting an electron from the valence band to the conduction band, with a penetration depth of 1/e = 1 mm. Electron-hole pairs (excitons) are created with a lifetime of 10’s of ms in pure Si. They are captured by impurities.
Introduction to PL continued. The exciton is captured by the impurity, exciting the impurity. Excited state Luminescence emitted Ground state
Introduction to PL continued. What can we observe? Only (usually) neutral centres (not charged). Concentrations over 1011 cm-3. Best 1014 to 1016 cm-3. Require: Samples with transparent surfaces (no contacts). Samples of about 8 x 8 mm2. (It is a contact-free, non-destructive technique!) Samples at T < 20 K. Liquid helium.
Introduction to PL continued. What do we observe? Very sharp optical transitions: energy resolution typically 0.1 meV at 1000 meV. Each sharp line is characteristic of one atomic-sized defect.
Very high spectral resolution. FZ Si with no oxygen and oxygen diffused, 24 GeV protons, 1016 cm-2. The spectral lines C, G, W have widths ~0.1 meV. Energy resolution is 1 part in 10,000.
Spectral resolution allows effects of isotopes to be measured: chemical identification.
Link to other techniques. (i) We see some of the Local Vibrational Modes of the defects, labelled L1 to L4 below. They can be seen by Infrared Absorption (Leonid Murin). ‘G’ = Cs - Ci
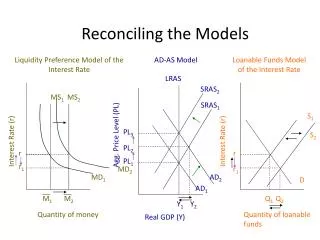
Link to other techniques. (ii) DLTS measures the difference in energy of one of our states to the band. We can link DLTS to PL (within the precision of DLTS). Conduction band DLTS Valence band
But… … PL does not detect some defects (for example the di-vacancy, or the simple hydrogen centres). It does not usually detect any charged defect.
Also, PL is not quantitative. PL from one species of defect is not usually proportional to the concentration of that species. We cannot simply say that if a PL signal is large, we have more of that species of optical centre. To understand this we have been looking at the similar problem (?) of ion-implanted silicon. [Work in collaboration with Paul Coleman, Bath University, UK]. Examples:
Luminescence is quenched by divacancies. For example in ion-implanted silicon, the mean separation of the divacancies decreases with dose as 1/ (dose)0.25. Positron data by Paul Coleman.
Crosses show measured intensity of W line. Line is calculated for quenching by energy-transfer to divacancies. At lower doses, the PL intensity is proportional to the dose, because there are fewer quenching defects.
The quenching process can be complicated so that the radiative decay is not exponential in time. For example, in ion-implanted silicon, PL from the ‘X’ centre (four interstitials?) has a complicated decay curve. (In collaboration with Tom Gregorkiewicz, Amsterdam University.)
Given this lack of knowledge, we need a) to understand the quenching process, b) to understand the link between PL intensity and concentrations.
Three studies in progress: Irradiation at CERN with 24 GeV protons for optical absorption measurements on the same centres that are observed in PL. (Optical absorption is proportional to the concentration of the centre). Samples being prepared to measure the radiative lifetime of the relevant optical centres with different levels of damage. (Gives the factor linking absorption to concentration, and shows how the PL is affected by damage in the sample). Samples being implanted to study the trapping of the self-interstitial by C in very high carbon silicon. (To check the linearity of damage production at low doses).