Download
1 / 15
150 likes | 285 Views
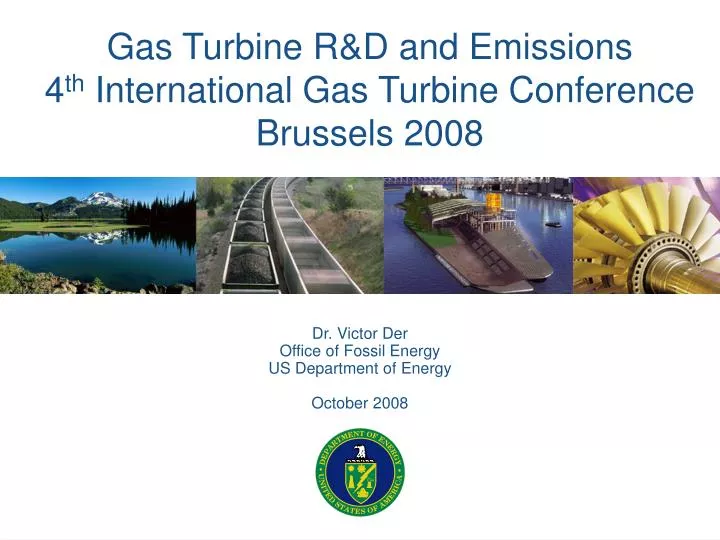
Gas Turbine R&D and Emissions 4 th International Gas Turbine Conference Brussels 2008. Dr. Victor Der Office of Fossil Energy US Department of Energy October 2008. Gas 24%. Gas 26%. Coal 25%. Coal 27%. Nuclear 6%. Nuclear 5%. Oil 37%. Oil 33%. Renewables 8%. Renewables 9%.

E N D
Gas Turbine R&D and Emissions4th International Gas Turbine ConferenceBrussels 2008 Dr. Victor Der Office of Fossil Energy US Department of Energy October 2008
Gas 24% Gas 26% Coal 25% Coal 27% Nuclear 6% Nuclear 5% Oil 37% Oil 33% Renewables 8% Renewables 9% Growing World Energy Demand World Energy Consumption Today World Energy Consumption 2030 465 QBtu or 490 EJ 86% Fossil Energy 722 QBtu or 761 EJ 87% Fossil Energy World today and tomorrow data from EIA AEO 2007, early release for years 2006 and 2030. World today and tomorrow data from EIA IEO 2006 for years 2006 (extrapolated) and 2030. U.S. Department of Energy U.S. Department of Energy 2 2
Current US Electricity Supply Mix Source: EIA U.S. Department of Energy 3
Projected Future U.S. Energy Useby Fuel *2008 Annual Energy Outlook
U.S. Emissions Limits • NOx • Emissions limits vary state to state (currently 0.98 to 75 ppmv) • Database of NOx emissions limits available at http://www.emissionslimits.org • CO2 • Not currently regulated but carbon financial instruments are traded on the Chicago Climate Exchange • May be subject to future regulation
Changes in Net GHG Emissions* 2000-2006 for 17 Major Economies *Includes emissions of carbon dioxide, methane, nitrous oxide, sulfur hexafluoride, hydrofluorocarbons, and perfluorocarbons, as well as emissions and removals of carbon dioxide, methane, and nitrous oxide from land-use, land-use change and forestry activities. **2006 UNFCCC data not yet available; 2001 through 2005 UNFCCC data used. ***No UNFCCC data available for time period; 2001 through 2005 IEA data used. Sources: 2008 National Inventory Reports and Common Reporting Formats at http://unfccc.int/national_reports/annex_i_ghg_inventories/ national_inventories_submissions/items/4303.php and IEA Online Energy Services a http://data.iea.org/ieastore/statslisting.asp (Accessed June 2 2008).
Reducing Emissions through Efficiency and Carbon Capture and Storage (CCS) • Efficiency • Maximizing efficiency is a major pathway to reducing CO2; • At least 1.7 gigatons of CO2 emissions per year could be avoided through steps to raise worldwide efficiency (IEA report) • Carbon Capture and Storage (CCS) • Indispensible technology to deal with energy and climate concerns
Regional Partnerships Large Scale CO2 Injection Demos Commercial Demos with Promising Advanced Technology 1MM Tons/Yr CCPI 3 W / CCS FutureGen Integrated IGCC-CCS Cost and Energy Penalty Reductions Near-Term Opportunities Siting / Permitting Near-Zero Emissions Coal Sequestration R&D: Safe, Long-Term CO2 Storage Subscale Field Tests Data, MMV Modeling Risk Analysis Best Practices CCS Integration Demos CO2 Regulatory Framework Near Zero-Emissions R&D: • Advanced Low-cost Capture • Efficiency Improvements • Combustion and Gasification Commercial Deployment
DOE Office of Clean Coal programs that address these goals: • Advanced Turbines • Gasification • Advanced Research • Fuel Cells • Innovations for Existing Plants • Carbon Sequestration • Fuels from Coal The Low NOx Hydrogen-Fired Turbine is a Key Component of the DOE Clean Coal Program U.S. Department of Energy Advanced Power Systems Goals (Coal-Based Power) • 2010: • 45-50% Efficiency (HHV) • 99% SO2 removal • NOx< 0.01 lb/MM Btu • 90% Hg removal • 2012: - Carbon Capture • 90% CO2 capture • <10% increase in COE for IGCC • <20 % increase in COE for PC • 2015: • Multi-product capability • 60% efficiency (w/o Carbon Capture and Storage)
Advanced Turbine ProgramContribution to FE Advanced Power Systems Goals • 2010 - IGCC • 2 – 3 % pts CC efficiency improvement • 20 – 30 % reduction in CC capital cost • 2 ppm NOx in simple cycle exhaust • 2012 – Carbon Sequestration (IGCC w/CCS) • Maintain 2010 performance with hydrogen fuels • 2015 – Carbon Sequestration (IGCC w/CCS) • 3 – 5 % pts CC efficiency improvement • 2 ppm NOx in simple cycle exhaust • Additional reductions in CC cost per MW
Low NOx Hydrogen-Fired Turbine Technology Development • Large Frame Turbine Technology • GE • Siemens • Additional Combustion Technology • Lawrence Berkeley National Laboratory • University Turbine Systems Research (UTSR)
Concluding Remarks • Society challenges us with the expectation of affordable, reliable, clean electricity including the need to address climate change concerns. • World and National electricity demands and environmental concerns require timely advancements in turbine technology to achieve affordable Near-Zero Emissions electricity. • DOE FE has a successful history of working with private sector to advance technologies such as Gas Turbine Systems • Continued focused efforts of the International Gas Turbine community will be needed to achieve efficiency and emission reduction goals