Download
1 / 11
110 likes | 264 Views
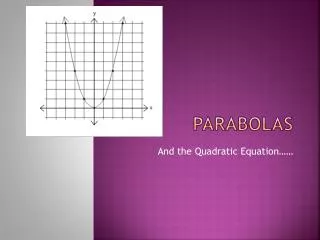
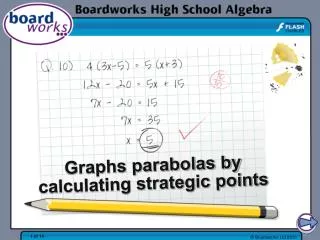
Graphs parabolas by calculating strategic points. Strategic points to calculate. Establish orientation of parabola Axis of Symmetry Vertex Roots y- intercept If you do not have 5 points substitute a value for x and calculate the corresponding y. Parabolas. y = ax 2 + bx + c

E N D
Strategic points to calculate • Establish orientation of parabola • Axis of Symmetry • Vertex • Roots • y- intercept • If you do not have 5 points substitute a value for x and calculate the corresponding y
Parabolas y = ax2 + bx + c When the coefficient of x2 is positive the graph is -shaped. When the coefficient of x2 is negative the graph is -shaped.
Parabolas …and a turning point called the vertex. Parabolas have a vertical axis of symmetry … The axis of symmetry is a vertical line The equation of a the axis of symmetry is EC The vertex is located on the axis of symmetry – it has a x-coordinate of Find the y-coordinate by plugging in for x
Sketching graphs of quadratic functions The quadratic function y = ax2 + bx + c will cross the y-axis at the point (0, c). Sketch the graph of the function y = x2 – 2x – 3. y = 2x2 – 5x – 3 c = – 3 The parabola crosses the y-axis at the point (0, –3). Axis of symmetry: Vertex
Sketching graphs of quadratic functions When a quadratic function factors we can use its factored form to find where it crosses the x-axis. For example: Sketch the graph of the function y = x2 – 2x – 3. The function crosses the x-axis when y = 0. x2 – 2x – 3 = 0 (x + 1)(x – 3) = 0 x + 1 = 0 or x – 3 = 0 x = –1 x = 3 The function crosses the x-axis at the points (–1, 0) and (3, 0).
Sketching graphs of quadratic functions (3, 0) (–1, 0) y (0, –3) (1, –4) 0 x We can now sketch the graph. • Establish orientation of parabola: open up • Axis of Symmetry x=1 • Vertex (1,-4) • y- intercept y=-3 • Roots x=-1 or x=3
Sketching graphs of quadratic functions In general: When a quadratic function is written in the form y = a(x – p)(x – q), it is called factored form and p and q are the roots of the quadratic function.
You try • Find • Establish orientation of parabola • Axis of Symmetry • Vertex • Roots • y- intercept Then graph the parabola