Visual Threads: In-depth Debugging & Analysis Tool
Visual Threads automatically analyzes running programs to detect and report programming errors, including common threading errors and violations of user-defined rules. It visualizes the application state, current thread objects, and object relationships, providing statistical analysis to identify the source of lock contention. The tool helps debug issues like deadlock errors, mutex relocking, and unprotected shared data. It supports C, C++, Java, and all threads APIs without language-specific dependencies. Get started with Visual Threads to improve your application's performance effortlessly.

Visual Threads: In-depth Debugging & Analysis Tool
E N D
Presentation Transcript
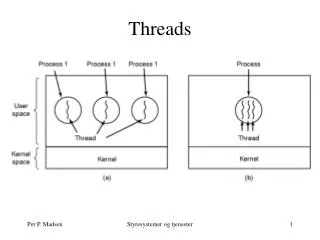
Visual Threads In-depth threads debugging and analysis
Visual Threads • Automatically analyzes running program • Detects and reports programming errors • Common threading errors • Violations of user-defined rules • Visualizes application state • Current thread objects • Object relationships • Provides statistical analysis • Identifies source of lock contention
Examples of problems detected • Deadlock and locking errors leading to deadlock • Mutex relocked by the same thread • Thread unlocks mutex it does not hold • Condition variable is used with multiple mutexes or with unlocked mutex • Thread terminates with stack-local objects • Priority inversion • High levels of stack usage • Unprotected shared data (Tru64-only) • Poor NUMA data locality (Tru64-only)
Steps toward a better application • Run application under Visual Threads • Most automated • Works for a limited set of known problems • No preparation necessary • Check for unguarded data (Tru64-only) • Manual analysis • Monitor state of threads objects • Watch detailed state changes as they occur • Enable and validate various statistics • Profile lock activity
Getting started • Load your application in Visual Threads • No source change required • Works with existing executables • explicitly supports C, C++, and Java • no language-specific dependencies (should work for Fortran, Ada, etc.) • supports all threads APIs (CMA, DCE, TIS, and POSIX) • debug compiler option recommended (-g or /DEBUG) • Run it!
Interpreting an alarm • Read the text carefully • View application source code for context • Navigate objects to better understand the program behavior being reported • Use the Help button • Describes the problem reported • Recommended actions • Use debugger to access program variables (if synchronized)
Completing first step • Diagnose each reported alarm • Correct detected problems • Some warning violations do not cause alarms • Click on any warning icons that are displayed on the bottom of the control panel • Or navigate warning violations from Summary window • Once all issues are resolved, go deeper
Check for unguarded data (Tru64-only) • Enable unguardedData rule • From the run dialog, select Edit Rules… • Click the check box next to Data Protection • Run the program • It will automatically be instrumented to check for race conditions • Alarms describe data shared between threads without synchronization
write Unused Write, new thread Exclusive Shared-Modified Read, new thread Shared write Unguarded data algorithm • Each memory reference (load/store) is instrumented to check for a consistent set of locks • State transition model is used:
Unguarded data overview • Alarm fires on inconsistent protection • May fire on an access where the lock is held due to a previous access without the lock • Protection must be provided by atomic hardware instructions, a mutex, or read-write lock • Does not work with programs that manage memory creatively, e.g. Java and OpenMP
Benign unguarded data • Some alarms will represent benign race conditions • Synchronization is indirect (use lock to protect a cell which identifies the current owner, etc.) • The race is not a problem such as for an atomic assignment of a long word • Memory has been re-used by a private memory manager • See vti(5) man page for information about directives to suppress benign races
Diagnosing unguarded data • If unguarded data alarm is hard to interpret • Use unguardedTransitions rule to view all state transitions • Create an unguardedTransitions rule with the address (not variable) reported in the violation • Rerun the program (don’t re-instrument as that might change the address of interest) • Each access that causes a state transition will generate an alarm
Unguarded data overhead • Instrumentation time (10 seconds to 30 minutes) • Runtime checking (.1 to 50 times slower) • Doubles the size of the heap • Multiple files created • When unguarded data analysis is complete, use Cleanup Files… on File menu • Once all issues are resolved, on to next step...
Manually analyze and tune • Requires more time and effort • Can detect more subtle issues • Necessary for most performance problems • Summary analysis • Visualization • Control Panel & Statistic graphs • Lock Profiling, Thread Transitions, CPU Graph • View application state & monitor queries • Custom rules
Manual analysis overview • Start with analysis summary • Statistical hotspots that exceed thresholds • Lock granularity • Processor utilization • Investigate areas of high contention/usage • Profile lock activity to find out where • Use statistic graphs or rules to find out when • Investigate why/where threads are blocked • Watch graphs for anomalies
Summary analysis performed • Alarm summary • Profile results • Statistical hotspots that exceed thresholds • Lock granularity • Processor utilization • Mutex attribute warnings (error-check, recursive) • Shared cache lines • Data locality analysis report
Control panel highlights • Color coded for the obvious problems: • Too many blocked/deadlocked threads (red/gray) • Not enough threads running (yellow); compare to number of known processors • High thread activity in general (blue line peaks) • Optional lines to identify CPUs (use MB3) • Validate parallelism over time • Solid green up to number of processors • Use Thread Snapshot to review blocked status of threads
Lock profile graph • Profiled statistics • Number of locks • Wait time • Locked time • Contended locks • Failed try locks
Viewing application state • Monitor view • Concise view of state for multiple objects • Ordered by a statistic value • Supports queries • Dynamically updates • Object attributes • Shows all data available about a given object • Current relationships (owners, waiters, etc.) • Enabled statistics (current value, graph) • Details (address, id, priority, state, etc.)
Features for AlphaServer GS • Data locality analysis • Number of accesses per RAD • Access profiling to find out from where • Analysis of which RAD would improve locality • Object-specific analysis • Home RAD • Percent remote accesses (for locks) • Number of migrations (for threads) • RAD utilization in CPU Graph
CPU Utilization • Shows portion of each CPU utilized in each RAD • Threads utilizing each CPU • View as Line, Bar, or Pie Chart • Chick to view properties: • Threads • RADs • CPUs
Summary analysis • Highlights pages and synchronization objects with poor locality • Provides navigation into Data Layout view • Lack of page locality may be hidden by cache locality • Thread migration may limit tuning possibilities
Custom rules • Over 30 rules • May have parameters (symbols, wildcards) • May have an associated action • Some useful custom rules • Check if a statistic exceeds a threshold • Detect a particular event • Tru64-specific custom rules • Detect function enter/exit • Detect unprotected, unsafe function or library
Make a custom breakpoint • Define a rule to detect interesting state • Detect when more than 50% of lock attempts on lock MyLock are contended. • Detect when the number of waiters for mutex GuardMutex exceeds 3. • Run application with synchronization enabled • When the alarm occurs, choose Debug action and press OK
Other features to note • Capture/replay trace files • Use vttrace(1) command or from Visual Threads • Replay with different rules/statistics each time • Add -a option to do batch analysis and save only violations • Applications can generate megabytes per second! • Use Set Color to highlight a particular object • Event window shows detailed activity • Generally, more than you want to know • Find & Filter support to make it manageable
Platform differences • HP-UX, Linux, Tru64 UNIX, & OpenVMS • All the same basic product • Some differences in capabilities • Features not available on HP-UX/Linux • Rules that require instrumentation (race detection) • Cannot attach to running application or fast forward through execution • Features not yet available on OpenVMS • Rules that require instrumentation (race detection) • Setting environment variables from Run dialog • Changes to data collection options not dynamic • Cannot attach to running application or fast forward through execution • Cannot invoke editor from source display window
Visual Threads on HP-UX requirements • An Itanium processor running HP-UX 11.22 • A Java JRE version 1.3.1 or greater must be installed in the location /opt/java1.3. By default, HP-UX 11.22 systems provide an appropriate Java JRE. • 32-bit or 64-bit threaded applications to analyze linked against the shared libpthread library.
Tips for OpenVMS users • Starting Visual Threads • From the icon in the CDE application manager • Add @SYS$MANAGER:DVT$SETUP to your login and use dxthreads or vttracecommands • If application is linked with /DEBUG (necessary to have source access) you need to tell the debugger to GO after debugger starts
Visual Threads on OpenVMS • Requires OpenVMS/Alpha V7.2-1 and greater • Java runtime built-in, but you may need to install any required Java patches • TCP/IP needed for communication between Visual Threads and application • Shared memory buffers • Global sections • Pagefile quota • Setup->Options to change buffer size • Process quota for several sub-processes
Visual Threads on Tru64 UNIX • Requires V4.0D or greater • On V4.0D need the latest OS patches and DTKS • Make sure you have the requisite version of Java • Subset JAVJRE118 or greater • You can have any version of Java (including 1.2) you need as the default for your development • Always re-install Visual Threads after OS upgrade • The kit adjusts to the features available
Resources and links • Developer & Solution Partner Program http://www.hp.com/dspp • Comparison of thread implementations http://members.aol.com/drbutenhof/ThreadTable.html • Debugging threads on Tru64 Unix ftp://ftp.compaq.com/pub/products/visualthreads/VisualThreadsWP.pdf • Developers’ Toolkit Supplement http://www.tru64unix.compaq.com/dtk • Guide to POSIX Threads library http://www.tru64unix.compaq.com/docs
Visual Threads resource and links • More information and downloadable kits are available on the web: http://www.compaq.com/visualthreads • Send comments/questions to: Visual.Threads@compaq.com • We actively seek your feedback and input