Download
1 / 47
470 likes | 636 Views
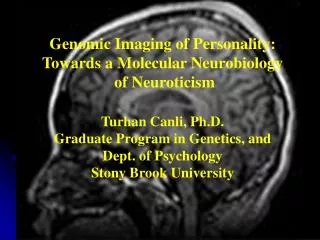
Genomic Imaging of Personality: Towards a Molecular Neurobiology of Neuroticism Turhan Canli, Ph.D. Graduate Program in Genetics, and Dept. of Psychology Stony Brook University. Neuroticism as a Fundamental Dimension Of Human Personality. Low-N. High-N. calm relaxed secure

E N D
Genomic Imaging of Personality: Towards a Molecular Neurobiology of Neuroticism Turhan Canli, Ph.D. Graduate Program in Genetics, and Dept. of Psychology Stony Brook University
Neuroticism as a Fundamental DimensionOf Human Personality Low-N High-N calm relaxed secure self-satisfied unemotional worried nervous insecure inadequate emotional • Report more negative experiences • Susceptible to negative mood induction • Vulnerability for Depression, Anxiety, other Mood Disorders
Phineas P. Gage Source: Dr. Hannah Damasio
A A A Simplified model which envisages a direct linear relationship between individual genes and behaviors Simplified model which envisages a direct linear relationship between individual genes and behaviors Simplified model which envisages a direct linear relationship between individual genes and behaviors B Gene networks and multiple environmental factors impacting on brain development and function, which in turn influence behavior Old and New Concept of Behavioral Genetics Hamer 2002
Personality and the Brain
Stroop Dot Probe Morph Faces Ratings N-Back Priming Emot. ACC InfParLob V1 FFA OFC PFC Hippo Amyg Deconstructing Neuroticism Perception Feeling Memory… Attention Psychological Domains Behavior Systems
Stroop Dot Probe Morph Faces Ratings N-Back Priming Emot. ACC InfParLob V1 FFA OFC PFC Hippo Amyg Deconstructing Neuroticism Perception Feeling Memory… Attention Psychological Domains Behavior Systems
Design “Press the button corresponding to the color as quickly and accurately as you can” 6 x 10 Pos 10 Neg 10 Neut 10 Pos Laughter Happy Kitten : : Murder Despair Hopeless : : House Car Book : :
R2 = .41 1.6 1.4 1.2 1 0.8 0.6 40 50 60 70 80 Neuroticism: AC Activation to Negative Words Negative-Neutral Canli et al., 2004, Beh. Neuroscience
Stroop Dot Probe Morph Faces Ratings N-Back Priming Emot. ACC InfParLob V1 FFA OFC PFC Hippo Amyg Deconstructing Neuroticism Perception Feeling Memory… Attention Psychological Domains Behavior Systems
ANGRY FEAR NEUTRAL SAD SCRAMBLED HAPPY (10) (10) (10) (10) (10) (10) Sequence Repeated Three Times Design “Press left button for male face, right button for female face as quickly and accurately as you can”
0.4 0.2 0 -0.2 -0.4 20 15 35 30 25 Neuroticism: De-Activation in SMG to Fearful Faces Fear-Neutral Supramarginal Gyrus Neuroticism Score Z = 28 mm
Stroop Dot Probe Morph Faces Ratings N-Back Priming Emot. ACC InfParLob V1 FFA OFC PFC Hippo Amyg Deconstructing Neuroticism Perception Feeling Memory… Attention Psychological Domains Behavior Systems
1 Scan = 5 Cycles 1 Cycle = 4 Negative, 4 Positive Pictures 1 Picture displayed for 7.5 sec each • • • Positive Negative • • • Design
r= -0.79 p < .0004 2 1 0 -1 0 10 20 30 40 Neuroticism: Middle Temporal Reactivity to Negative Pictures Negative-Neutral Neuroticism Score Canli et al., 2001, Beh. Neuroscience
What’s next? • Data show association between N and individual differences in brain activation to negative affective stimuli • What is the mechanism? • A genomic approach gets at the underlying molecular architecture…
1 2 3 4 5 6 7 8 9 10 11 12 13 14 15 16 17 18 19 20 21 X 22 Y Genes are organized in Chromosome Pairs(one from each parent) www.sparkingreaction.info/ media/chromosomes.jpg
Chromosomes are made of DNA Strands www.alumni.ca/~laued3e/ chromosome.jpg
These DNA Strands can vary across Individuals www.alumni.ca/~laued3e/ chromosome.jpg
A Single Nucleotipde Polymorphism (SNP) www.alumni.ca/~laued3e/ chromosome.jpg G - Guanine C - Cytosine G - Guanine C - Cytosine
Lesch 1996: Neuroticism and Variants of the Serotonin Transporter
Stroop Dot Probe Morph Faces Ratings N-Back Priming Emot. ACC InfParLob V1 FFA OFC PFC Hippo Amyg polymorph polymorph polymorph polymorph Deconstructing Neuroticism Perception Feeling Memory… Attention Psychological Domains Behavior Systems Cells, Genes & Molecules
P < 0.05, corrected L group S group Hariri et al., Science, 20025-HTT s allele: increased amygdala activation to angry/fearful faces Task: Face-matching vs. visuospatial matching
4 x 18 s 18 s 18 s 18 s 6 Pos 6 Neg 6 Neut 6 Fix Laughter Happy Kitten : : Murder Despair Hopeless : : House Car Book : : + + + : : Design “Press the button corresponding to the color as quickly and accurately as you can” (no resp. to fix)
Methods • Subjects • 41 healthy volunteers • 5-HTT genotypes: S-group:12 (4M) ss and 16 (9 M) sl; L-group: 13 (6 M) ll • No sig group diff in age, mood, neuroticism (or RTs), freq. of sex or ethnicity Scanning Parameters • 3T Siemens Trio Scanner • TR = 1500 ms, TE = 30 ms, • Flip = 80 degrees, FOV = 22 x 22 cm • 24 oblique (AC-PC) slices: 5 mm thick • 0 mm inter-slice space • In-plane resolution: • 3.43 mm x 3.43 mm • SPM2 2-sample ttest • A priori region: p < .05, corrected, 10 voxels extent
0.8 0.6 0.4 0.2 % Signal 0.0 -0.2 -0.4 S group L group 5-HTT affects amygdala activation to negative stimuli Negative – Neutral Canli et al., PNAS, 2005
Negative – Neutral Neutral – Fixation Negative – Fixation R 0.8 0.8 0.8 0.6 0.6 0.6 0.4 0.4 0.4 0.2 0.2 0.2 % Signal % Signal % Signal 0.0 0.0 0.0 R R -0.2 -0.2 -0.2 -0.4 -0.4 -0.4 S group L group L group S group S group L group A new interpretation
L PreCG ext. into PostCG and IPL 0.8 L Insula L Amygdala R Amygdala R PC R PostCG 0.6 0.4 ** 0.2 0.8 0.8 0.8 0.8 0.8 0.0 0.6 0.6 0.6 -0.2 0.6 0.6 ** -0.4 0.4 0.4 0.4 0.4 0.4 0.2 0.2 0.2 0.2 0.2 0.0 0.0 0.0 0.0 0.0 ** -0.2 -0.2 -0.2 -0.2 -0.2 ** * ** -0.4 -0.4 -0.4 -0.4 -0.4 S L S L S L S L S L S L L PreCG R STG L R 0.8 0.8 ** 0.6 0.6 * 0.4 0.4 0.2 0.2 0.0 0.0 -0.2 -0.2 * -0.4 -0.4 S L S L L STG L Precuneus L Putamen R MTG/ITG R FG R Precuneus 0.8 0.8 0.8 0.8 0.8 0.8 0.6 0.6 0.6 0.6 0.6 0.6 * * 0.4 0.4 0.4 0.4 0.4 0.4 0.2 0.2 0.2 0.2 0.2 0.2 0.0 0.0 0.0 0.0 0.0 0.0 * -0.2 -0.2 -0.2 -0.2 -0.2 -0.2 ** ** -0.4 -0.4 -0.4 -0.4 -0.4 -0.4 S L S L S L S L S L S L Beyond Affect and Amygdala
Gene x Life Stress = Depression? • Caspi et al., 2003, Science
4x 6x 6x 6x 6x + + Fixation (30 s) Fear (18s) Neutral (18s) Sad (18s) Happy (18s) Fixation (30s) Design “Press left button for male face, right button for female face as quickly and accurately as you can”
Methods Subjects: 42 healthy, normal volunteers, 21 male, genotyped for 5-HTT polymorphism: 10 l/l versus 32 s/l or s/s Stimuli: fixation, emotional and neutral faces Measures: mood, personality, life stress • 3T Scanner • TR = 3000 ms, TE = 45 ms, • Flip = 80 degrees, FOV = 20 x 20 cm • 35 oblique slices: 3.5 mm thick • 0 mm inter-slice space • In-plane resolution: • 2.35 mm x 2.35 mm • SPM2 2-sample ttest • A priori region: p < .05, corrected
Contrast L Group S Group Fear-Fixation 1 2 1.5 0.5 r = .54 r = - .42 1 0 0.5 % Signal % Signal 5 10 15 0 -0.5 5 10 15 -0.5 -1 -1 Life Events Life Events Happy-Fixation 1 1.5 1 0.5 r = - .52 r = .54 0.5 0 % Signal % Signal 0 5 10 15 -0.5 5 10 15 -0.5 -1 -1 Life Events Life Events Sad-Fixation 1 3 0.5 2 r =.45 r = - .48 0 1 % Signal % Signal 5 10 15 -0.5 0 5 10 15 -1 -1 Life Events Life Events Neutral-Fixation 1 2 1.5 0.5 r = .57 r = - .46 1 0 0.5 % Signal % Signal 5 10 15 0 -0.5 5 10 15 -0.5 -1 -1 Life Events Life Events Gene x Life Stress in the Amygdala
Caveats and Limitations • Sample Size • False Positives • Polymorphisms = N • Still correlational! • True causal models will require methods that manipulate genome
Future Projects • Other gene polymorphisms • Gene-environment interactions • Gene-sex interactions • Gene-gene interactions • True causal models will require methods that manipulate genome, i.e., transgenic animals
Collaborators Wuerzburg Klaus-Peter Lesch Andreas Fallgatter Nicole Steigerwald Yale Todd Constable Jamie Ferrie Stony Brook GCRC Directors and Staff: Nancy Wyllie, Marie Gelato, Diane Ruenes, Tracey Dourdounas, Joyce Quick, Ruthann Callahan, Stephanie Musso, et al. Canli Lab: Zenab Amin Eliza Congdon Brian Haas Kazufumi Omura
The real Brain: Anatomy The Real Thing
Frontal Lobe Corpus Callossum Cerebellum Brainstem The imaged Brain: Anatomy An MRI image
Increased neural activity Changes the magnetic signature of blood Increased blood flow BOLD Response Increased MRI signal
ROI Time Course fMRI Signal (% change) ~2s Condition Time Condition 1 Statistical Map superimposed on anatomical MRI image Condition 2 ... Region of interest (ROI) ~ 5 min Activation Statistics Functional images Time