Download
1 / 6
60 likes | 139 Views
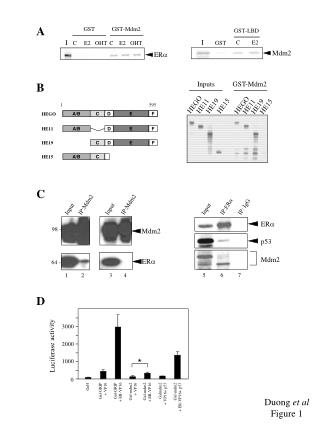
Study on the interplay between ERα, p53, and Mdm2 in cellular pathways using various experimental approaches and treatments.

E N D
ER p53 A GST GST-Mdm2 GST-LBD I I C E2 C E2 OHT C E2 OHT GST Mdm2 ERa B Inputs GST-Mdm2 1 595 HEGO HEGO HE19 HE15 HE11 HE11 HE15 HE19 HEGO A/B C D E F HE11 A/B D E F HE19 C D E F HE15 A/B C C IP:Mdm2 IP:Mdm2 IP:ERa IP: IgG Input Input Input 98 - Mdm2 Mdm2 ERa 64 - 5 6 7 1 2 3 4 D 3000 2000 Luciferase activity * 1000 0 Gal4 Gal-GRIP + VP16 Gal-mdm2 + VP16 Gal-GRIP + ER-VP16 Gal-mdm2 + ER-VP16 Galmdm2 + VP16+ p53 Gal-mdm2 + ER-VP16+ p53 Duong et al Figure 1
ER Actin Mdm2 Actin ER Actin Actin Actin A B MEFWT MEFdKO Control p53+Mdm2 C E2 C E2 C E2 C E2 ER ER C D CHX treatment (hrs) 0 2 4 Mdm2 ERa ER - + ++ w/o Estradiol ERa + Mdm2 ER Mdm2 overexpression - + Mdm2 - + - + Mdm2 MG132 - - + + Duong et al Figure 2
Mdm2RING ER Mdm2 WT Mdm2 Actin Mdm2RING ER ER Mdm2 Actin Mdm2 ER (HE11) Actin ER + Mdm2RING ER + Mdm2 WT A B ER GST-AF2 C E2 Input GST C D IP: ER C E2 Mdm2 170 - 130 - ER-Ub 95 - 72 - IB: Ub 55 - 1 2 3 43 - ER-Ub IB: ER 4 5 6 Mdm2 - + Duong et al Figure 3
ER p53 Actin ActD UV ER p53 A C E1 E2 E3 DES C E1 E2 E3 DES ER ER p53 p53 Actin Actin Control MG132 B C UV ActD Control MG C E2 C E2 C E2 C E2 4 3 Apoptosis (AU) 2 1 0 C MG D Control UV C E2 OHT ICI C E2 OHT ICI Actin Duong et al Figure 4
A B CHX treatment (hrs) 0 2 4 6 E2+UV ER E2 100 p53 ERa levels (% of control) ER E2 E2 +UV p53 10 6 0 2 4 Hours of chase C 2h 4h 8h - + - + - + E2 ER p53 Actin Control ER p53 Actin RITA Duong et al Figure 5
ER Actin actin p53 pS2 A B C Control MEFdKO Control UV 500 E2 1200 C E2 C E2 400 1000 800 300 Relative luciferase activity 600 200 400 100 200 0 0 C UV C E2 C E2 p53+Mdm2 Control D 900 BG1 cells 800 700 C E2 600 Relative luciferase activity 500 400 300 200 100 0 C E2 OHT ICI C E2 OHT ICI MCF7 BG1 Duong et al Figure 6