Download
1 / 1
10 likes | 84 Views
This study explores the muscle activity patterns in relation to hip and knee positions in one leg, using polar plots and vector analysis. Significant muscle phasing patterns and activation timing during different phasing conditions are examined. The research provides insights into the coordination of muscles during movement.

E N D
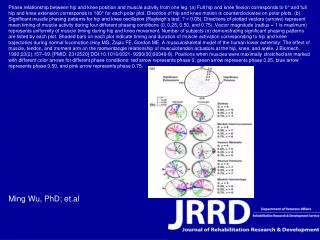
Phase relationship between hip and knee position and muscle activity from one leg. (a) Full hip and knee flexion corresponds to 0° and full hip and knee extension corresponds to 180° for each polar plot. Direction of hip and knee motion is counterclockwise on polar plots. (b) Significant muscle phasing patterns for hip and knee oscillation (Rayleigh’s test, ? < 0.05). Directions of plotted vectors (arrows) represent mean timing of muscle activity during four different phasing conditions (0, 0.25, 0.50, and 0.75). Vector magnitude (radius = 1 is maximum) represents uniformity of muscle timing during hip and knee movement. Number of subjects (n) demonstrating significant phasing patterns are listed by each plot. Shaded bars on each plot indicate timing and duration of muscle activation corresponding to hip and knee trajectories during normal locomotion (Hoy MG, Zajac FE, Gordon ME. A musculoskeletal model of the human lower extremity: The effect of muscle, tendon, and moment arm on the momentangle relationship of musculotendon actuators at the hip, knee, and ankle. J Biomech. 1990;23(2):157–69. [PMID: 2312520] DOI:10.1016/0021- 9290(90)90349-8). Positions when muscles were maximally stretched are marked with different color arrows for different phase conditions: red arrow represents phase 0, green arrow represents phase 0.25, blue arrow represents phase 0.50, and pink arrow represents phase 0.75. Ming Wu, PhD; et.al