Download
1 / 8
80 likes | 269 Views
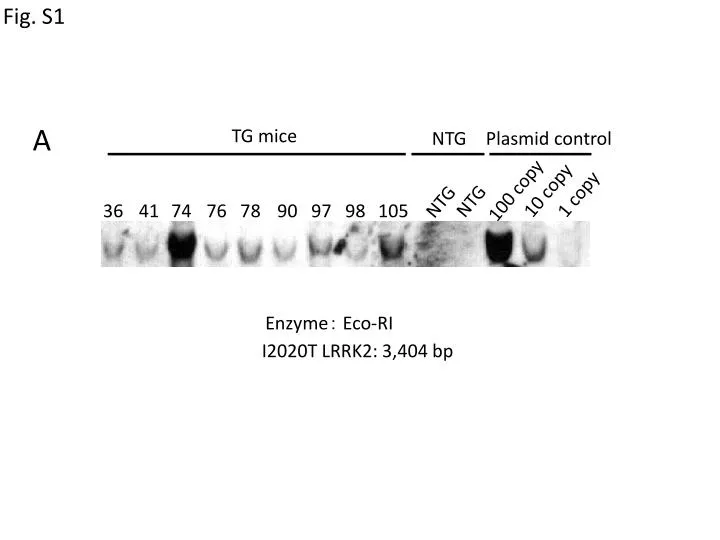
Fig. S1. A. TG mice. NTG. Plasmid control. 10 copy. 100 copy. 1 copy. NTG. NTG. 36. 41. 74. 76. 78. 90. 97. 98. 105. Enzyme : Eco-RI. I2020T LRRK2: 3,404 bp. B. 10K. Bgl II. Eco RI. 8. 41. 74. B6. 41. 74. B6. 6. 5. 4. 3. 2.5. 2. 1.5. 1.

E N D
Fig. S1 A TG mice NTG Plasmid control 10 copy 100 copy 1 copy NTG NTG 36 41 74 76 78 90 97 98 105 Enzyme: Eco-RI I2020T LRRK2: 3,404 bp
B 10K Bgl II Eco RI 8 41 74 B6 41 74 B6 6 5 4 3 2.5 2 1.5 1 Tandem LRRK2: 2310 bp (Eco RI) 2474 bp (Bgl II) 0.75
Fig. S2 NTG TG NTG TG NTG TG Wb St Mb
Fig. S3 NTG TG ** TH Fluorescence intensity of LRRK2 LRRK2 Overlay Scale bar:10μm
Fig. S4 ** * * (wks) 34 42 59 34 42 59 34 42 59 34 42 5934 42 59 day1 day2 day3 day4 day5 Training session
Fig. S6 Blind Visible Blind Visible NTG TG
Fig. S7 V5 GM130 Overlay


![[PDF] 100 Loaves Breadmaking as Meditation (Paperback) - Common - Copy](https://cdn4.slideserve.com/8337646/slide1-dt.jpg)