Navigating 2009's Utility Trends: Capitalizing on Fuel and Economic Volatility
This comprehensive 9th annual edition of Utility Trends by Marc Goldsmith & Associates LLC emphasizes the significant developments in the utility sector since last year, highlighting predictions on volatility in fuel, economic, political, and financial realms. As the industry transitions, utilities must be agile and ready to respond to unpredictable changes. This report serves as a strategic tool for innovative thinking, equipping organizations to thrive amidst uncertainty by adapting their planning and operations to handle increasing volatility and fluctuating market conditions.

Navigating 2009's Utility Trends: Capitalizing on Fuel and Economic Volatility
E N D
Presentation Transcript
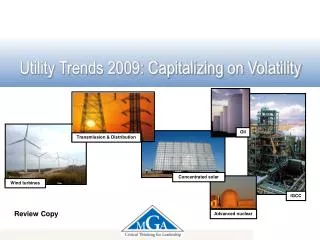
Oil Transmission & Distribution Wind turbines Concentrated solar Advanced nuclear Utility Trends 2009: Capitalizing on Volatility IGCC Review Copy
Trends Overview 2007 Trends Overview 2009 This is the 9th annual edition of Marc Goldsmith & Associates LLC’s Utility Trends. There have been significant developments in both markets and regulations since last year’s Utility Trends. The information contained herein is a distillation of concerns raised by MGALLC’s worldwide clients. Utility Trends is intended as a tool for innovative thinking about the rapidly changing utility environment and as a context for strategic planning. These trends are predictions based on experience and research: a number of factors can influence the accuracy, speed, and direction of these predictions. Brace yourself: Volatility is the story for 2009 Fuel Volatility Economic Volatility Political Volatility Financial Volatility 1 2 3 4 How can your organization position itself to thrive?
First Principles Principles Volatility is defined as unpredictable change. This document is concerned with four kinds of volatility—fuel, economic, political and financial. For a time, the economy was believed to have been in a period of decreased volatility, dubbed “The Great Moderation”, because many economic variables appeared to have achieved relative stability. The return of volatility is an indication that the concepts behind the Great Moderation were guided by false beliefs • A healthy utility industry is essential to a healthy U.S. economy … and healthy customers are essential to a healthy industry. • Many of the fundamentals that have guided the industry for the last 75 years are in transition. • Volatility is a given … how you respond is your call. • Low fuel prices are not sustainable … plan for a high fuel price future. • Winners are made in down times … requiring action in less than ideal circumstances. • Even the most disciplined planning cannot anticipate radical changes that can alter the landscape and the outcome … flexibility and agility are critical. • Inaction is the riskiest response in uncertain times
Situation Trend 1: Fuel Volatility • The economy is reeling from huge price swings in both natural gas and fuel oil (highs of $10.50 per Mcf and $140 per barrel, respectively). Prices have tumbled an order of magnitude from their historic high in July 2008 to a new five year low and are still unpredictable. • Electric generators are huge consumers of fuel. Electric fuel use has been historically weather dependent and seasonal; now it is unpredictable. • Generators do not adapt well to huge price surges and retreats. This is because planning and operations are highly optimized and vulnerable to fuel price volatility. • Decisions regarding pricing, dispatch and generation planning must be made regardless of the difficulty of circumstances. Failure to do so is perilous. • Utilities have significant experience handling natural weather variations. They are less well equipped to manage fuel supply disruptions or constraints based on environmental concerns. Grids are even more sensitive to change and the intermittent nature of renewable resources creates difficulties.
Implications Trend 1: Fuel Volatility • Experts unanimously believe that fuel prices will rise and we agree, and these rises will be accompanied by increasing price volatility. New resources such as carbon-free fuels (nuclear energy, wind and solar power) are more capital-intensive and expensive than existing base electric load. • Reducing fuel volatility and supply risk is difficult, complex and sometimes costly. Wildly divergent forecasts, detached from reality, make managing fuel costs tricky. Fuels risks can be better managed with: • Diversity in generation supply and fuels • More forecasting not less and supporting scenario analyses to assess high- and low- side directions and probabilities • More extensive fuel procurement planning and flexibility (hedging leads to lower risk but not necessarily lower cost) • More diversity in fuel suppliers • Greater investment in less volatile or lower fuel cost generation such as renewable energy (no fuel cost), coal and nuclear (low or less volatile fuel cost)
Implications Natural Gas Prices Past Trend Present Value & Future Projection, Henry Hub. US Dollars per Million BTU Trend 1: Fuel Volatility Anticipating natural gas and other fuel prices is very difficult. In the current environment it has become particularly difficult since fluctuations have deviated from traditional economic theory and explanations. z
Situation Trend 2: Economic Volatility • The downturn in the global economy has impacted the utility industry in the form of reduced electric use, increased account delinquencies and less certain forecasts. • Businesses and consumers are bombarded with economic news which fuels panic and poor decision making. • In the midst of these economic problems; DOE forecasts that the rates consumers pay for electricity will rise an average of 5.2% in 2008. and in 2009? • Recovery from the economic downturn may create a shift in consumption patterns based on industry created, relative world pricing of energy and level of environmental restrictions on manufacturing. • One part of the bottom line for utilities is revenue erosion as the historic growth (1% to 2%) fails to materialize. • Utilities and generators are consequently slowing development of new generating capacity, transmission upgrades and higher cost efficiency programs, thereby contributing to further longer-term cyclic cost increases.
Implications Gross Domestic Product Source: Wall Street Journal Trend 2: Economic Volatility • A mean forecast of GDP from a Wall Street Journal survey conducted in December 2008 indicates a consensus that growth will resume around mid-year 2009 (right). • There is considerable disagreement regarding the timing and strength of the recovery. • However, the energy sector has historically operated in its own cycles, as does health care. • Current extreme credit volatility has taken the energy industry by surprise.
Implications Trend 2: Economic Volatility • Over the course of 2008, manufacturers of alternative energy experienced a surge in global demand, followed by a sharp drop in interest. • In the first half of 2008, manufacturers of Q-Cells (solar panels) and Vestas (wind turbines) were having trouble keeping up with global demand. Now orders are hard to come by. • Utilities once again need to reassess business processes, procedures, technology and find ways to improve business efficiency through: • More cross-training, opportunistic hires / fires, better leverage of intellectual capital • Selective acquisitions to improve production, diversify resources and strengthen market position • Advanced technology to reduce staffing, increase wrench time, improve capital performance (i.e., more functionality in mobile computing, better coordination on infrastructure, decreased disruption, advanced meter infrastructure, smarter grid) • Greater efficiency in all parts of the organization (from collections to storm recovery) • Upgrades to existing plant and equipment for improved performance, output and efficiency.
Implications Trend 2: Economic Volatility • Electricity prices are going to increase. The causes of the increases will change from energy cost to transmission or capacity cost (caused by a large investment in non-carbon fuels) • This fact, combined with broader economic uncertainties at utilities, creates pressure to do something. However, a disorganized response can produce uncoordinated actions that target the wrong problem or overshoot the right one. • Current plans are also now at risk. Utilities were expected to invest as much as $2 trillion by 2030 to modernize their electric systems and meet future needs. As electricity demand declines, generators and utilities must either make significant adjustments to their investment plans or run the risk of building too much capacity. • Greater consolidation in the utility sector is anticipated, although it is not evident that this will achieve either lower cost or a more desired stability.
Situation Trend 3: Political Volatility • Generators and utilities are governed by many kinds of rules influencing the business, including their interactions with the markets, environmental protection and customer responsibilities. In the past, these rules were in the form of Utility Commission regulation. • Today, ISOs and RTOs make the market rules which have the effect of regulation and are designed (not always succeeding) in making the markets easier, transparent, cheaper, reliable and more accessible. • If deregulation was to mean less rules than it has essentially lost its meaning—as the U.S. electric industry has become deregulated; rules have increased. • In other words there are now more rather than fewer rules, and rules that are increasingly sophisticated and complex (making transparency difficult) and the rate of change is accelerating creating volatility. • A complicating factor for 2009 is the new administration and congress with a different agenda from the old which will create a whole new Federal set of rules.
Implications Trend 3: Political Volatility • This rules volatility has made utility and generator planning more difficult and new construction more risky. • Historically, utilities understood PUC intentions and consistently exhibited conservatism. This avoided marring their relationships. • The changing structure of the utility industry, and greater complexity and number of rules have altered compliance. Deregulated companies are typically less cautious and more willing to accept penalties for over-reaching. • Stabilizing the ground rules is necessary to allow advances in the industry, or industry and regulators will continue to struggle with and not make decisions, opting to delay and/or pursue less risky and less desirable options. • All parties and partners must be willing to give something from their agendas in order to reduce the plethora of new rules and regulations at the State, ISO (regional) and Federal levels.
Implications Trend 3: Political Volatility • Your competitive advantage can be found in understanding the rules better than other companies. This can be done by focusing on the critical rules that impact profitability: • Promoting principles for rule setting that make the rules, transparent , fair and sustainable • Participating in the key rules forums for early insight • Developing and nurturing alliances • Performing closer to the limits of the rule and continually assessing the risks of exceeding the limits • Advocating for rule stabilization is critical. The question to ask is – “Is it really necessary to create this rule or change that one?” Add rigor to the process, demand good public policy and solid business reasons for change.
Situation Trend 4: Financial Volatility • The utility and generation industry is capital intensive and dependent on many credit arrangements. These include financial instruments such as counter party credit, derivatives and hedges to manage exposure to risks, and higher costs. • As credit has locked up, utility companies are finding it difficult to fund new projects and are delaying plans to modernize power plants and upgrade power distribution systems. • Counter-parties to trade electric and gas commodities are being reduced increasing security requirements. • Liquidity is at a premium. • Before the financial crisis, investor-owned utilities planned to spend over $1 trillion over the next 20 years on new plants, transmission lines and maintenance. This now appears optimistic as the stability, capital and business will to make these investments is no longer there. Infrastructure will suffer.
Implications Trend 4: Financial Volatility • Government intervention, support, and control will increase to reduce the impacts of a slowing economy. • Credit will be tight and financial liquidity will be valued. • There are fewer market participants and counter-parties to transact with and to share exposure to the risks of financial instability. • There will be fewer lenders with more requirements. • Capital spending will contract. • There will be greater competition internally and externally between generation and transmission for capital. • Your advantage comes from looking beyond the downturn to accelerating out of the recession/depression by: • Obtaining new talent • Broadening financial relationships • Improving credit worthiness • Improving process efficiency • Selectively acquiring new market share
Implications Historical Trend Notes MGALLC has been issuing Trends for nine consecutive years, and it is valuable to analyze our track record and learn from our errors: • We have been commenting on the unreliability of EIA fuel price forecasts for years; EIA didn’t start to get bad at forecasting in the past year. • We correctly predicted the formation of the natural gas cartel. • We were correct that capacity and energy markets would continue to diverge. • We anticipated keen interest in programmable loads. • We continue to believe that re-regulation is on the rise. What keeps us AWAKE What we got RIGHT What we got WRONG • Our crystal ball did not portend the severity of the financial market meltdown in second half of 2008. • While many of the trends in our 2008 report were borne out, their relevance was overshadowed by the financial crisis. • We cannot predict when the economy will stabilize as the bellwethers we would look to are no longer reliable (e.g., publicly traded companies not reporting 2009 guidance). • We do not know the extent to which pressing economic concerns will delay major initiatives to address environmental imperatives. • Last year we were worried about low investment in R&D. This year we still are.
Situation Volatility Index • Volatility is tied to your business drivers. • Defining and analyzing the related volatile areas will help define the scenario boundaries for your strategic planning. • Which areas are important and what direction do you think they are trending in? • Take a minute an assess where you think the volatility factors, currently operating in your space, are using the next page. • Think about volatility in terms of the next 5 years. • If you care to share your thoughts; we will post them on the website anonymously along with others such that we can begin to see the consensus direction. If you are having trouble filling the chart in and would like to talk, call or write MGALLC at the addresses at the end of the slide set.
Rising Cost Deep Recession Major continual change Uncertainty Volatility Index Volatilty Index: The Spectrum 1 2 3 4 5 6 7 8 9 10 Declining Cost Fuels Economy Political Financial Shallow Recession Stable Rules Stabilization
Volatility Index Volatilty Index: The Spectrum What we think 1 2 3 4 5 6 7 8 9 10 Declining Cost Rising Cost Fuels: Economy: Rules: Finance: Shallow Recession Deep Recession Rule Volatility Stable Rules Stabilization Uncertainty The example above yields an average volatility score of 6.5 which implies moderate to high volatility.
Implications Volatility Index MGALLC thinks that: • Political volatility will remain for the longer-term. • Financial volatility will ease in 2009. • Economic activity as reflected by the downturn will bottom and start to rise in 2009. • Fuels will continue to be volatile but will not rise to the highs of July 2008. We expect oil to stabilize in the $60 range, with post-Gaza war and post winter impacts. • Using drivers and scenarios will be increasingly important in 2009. • Tools like the volatility index can help make sure your team is on the same page from a planning and strategy perspective. Normalizing assumptions, beliefs and principles is critical to a good planning process.
Additional Information Marc Goldsmith, President Marc Goldsmith & Associates, LLC 289 School Street Belmont, MA 02478 Tel. 617.484.4664 Tel: 617.416.7638 Marc@mgallc.net www.mgallc.net Marc Goldsmith & Associates LLC serves the power industry, applying over thirty years expertise to energy-related problems and opportunities. The firm consults, manages, and participates in projects addressing every area of utility construction, regulatory management, operations, and deregulation. Its founder and President, Marc Goldsmith, started and built several consulting and energy companies. He has created new organizations, redesigned old ones, and advised large companies on changing to meet new competitive, technological, and regulatory challenges. He also helps companies break new ground in thinking about technology, deregulation, and business models. Marc Goldsmith & Associates LLC has a proud history of advising senior executives in the infrastructure businesses on business models, deregulation, operations, strategy and regulatory policy.