Download
1 / 25
260 likes | 443 Views
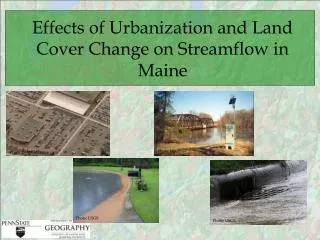
Effects of Urbanization and Land Cover Change on Streamflow in Maine. Photo: USGS. Photo: Bing bird’s eye view. Photo: USGS. Photo: USGS. Presentation Overview. Background Population & land cover change in Maine Effects of altered stream flow Study Areas Where and why? Data Sources

E N D
Effects of Urbanization and Land Cover Change on Streamflow in Maine Photo: USGS Photo: Bing bird’s eye view Photo: USGS Photo: USGS
Presentation Overview • Background • Population & land cover change in Maine • Effects of altered stream flow • Study Areas • Where and why? • Data Sources • Methods & Analysis • IHA • Modifying land cover based on population • Linear regressions • Potential Challenges
Background Study Area Data Methods/Analysis Potential Challenges Has Development in Southern Maine Resulted in Altered Stream Flows? This project will seek to answer the following question: “Is there a correlation between urban development and altered stream flow characteristics in Southern Maine as compared to Northern Maine, where development has been much more limited?” ? ? Photo: Bing bird’s eye view
Background Study Area Data Methods/Analysis Potential Challenges Southern & Coastal Maine is Urbanizing, Northern Maine is Remaining Rural • 1980 – 2000: Maine population increased 3.8% • York County (southernmost) increased 13% • Aroostook County (northernmost) decreased almost 15% Data Source: US Census Bureau
Background Study Area Data Methods/Analysis Potential Challenges Southern & Coastal Maine is Urbanizing, Northern Maine is Remaining Rural • 1960 – 2000: Maine population increased 31.5% • York County (southernmost) increased 87% • Aroostook County (northernmost) decreased 30% Data Source: US Census Bureau
Background Study Area Data Methods/Analysis Potential Challenges Altered stream flows have ecological impacts • Intra-annual variation is important to the life cycles of many aquatic, riparian and wetland species (Richter et al) • Altered hydrology effects this variation and habitat characteristics through peak/minimum flows, water temperature, oxygen content, sediment
Background Study Area Data Methods/Analysis Potential Challenges Study Area: ~25 Catchments in Northern and Southern Maine • DRAFT watersheds – Canadian/NH data? • Southern and coastal counties tend to have a greater % of impervious surface (developed) • Small watersheds where possible – stronger response signal to land cover (Poff et al). • Limited by gage records
Background Study Area Data Methods/Analysis Potential Challenges All Data Publicly Available on the Internet • Streamflow data • USGS Daily Streamflow Data • Land cover data • 2001 NLCD • 2004 MELCD • NOAA C-CAP 1985, 1993, 1996, 2001, 2006 (some years coastal portions only) • 1993 GAP • *USGS Land Cover Trends Data
Background Study Area Data Methods/Analysis Potential Challenges Altered stream flows have ecological impacts • The “Indicators of Hydrologic Alteration” (IHA) toolkit, developed by a team at The Nature Conservancy will be used to look for ecologically significant changes in hydrology over time • (http://www.nature.org/initiatives/freshwater/conservationtools/art17004.html)
Background Study Area Data Methods/Analysis Potential Challenges IHA Will be Used to Evaluate Ecologically Significant Hydrologic Changes Over Time • Hydrologic Indicators are all derived from Daily Mean Data (Available online from USGS) • 32 Indicators broken into 5 categories • Timing of annual extreme conditions • Magnitude of monthly water condition • Frequency and Duration of high and low pulses • Magnitude and Duration of a annual extreme conditions • Rate and frequency of water condition change Photo: USGS California Photo: USGS Wisconsin Water Science Center
Background Study Area Data Methods/Analysis Potential Challenges IHA Will be Used to Evaluate Ecologically Significant Hydrologic Changes Over Time • 32 Indicators broken into 5 categories • Magnitude of monthly water condition • Timing of annual extreme conditions • Frequency and Duration of high and low pulses • Magnitude and Duration of a annual extreme conditions • Rate and frequency of water condition change • Soil moisture stress for plants • Availability of floodplain habitats for aquatic organisms • Nutrient and organic matter exchanges between river and floodplain • Access for waterbirds to feeding, resting, reproduction sites • Influences bedload transport, channel sediment textures, and duration of substrate disturbance (high pulses) Adapted from: The Nature Conservancy, 2007. Indicators of Hydrologic Alteration Version 7 User's Manual
Background Study Area Data Methods/Analysis Potential Challenges IHA Will be Used to Evaluate Ecologically Significant Hydrologic Changes Over Time • 32 Indicators broken into 5 categories • Magnitude of monthly water condition • Timing of annual extreme conditions • Frequency and Duration of high and low pulses • Magnitude and Duration of annual extreme conditions • Rate and frequency of water condition change • Creation of sites for plant colonization • Soil moisture stress in plants • Anaerobic stress in plants • Duration of stressful conditions such as low oxygen an concentrated chemicals in aquatic environments • Distribution of plant communities in lakes, ponds, floodplains • Duration of high flows for waste disposal, aeration of spawning beds in channel sediments Adapted from: The Nature Conservancy, 2007. Indicators of Hydrologic Alteration Version 7 User's Manual
Background Study Area Data Methods/Analysis Potential Challenges IHA Will be Used to Evaluate Ecologically Significant Hydrologic Changes Over Time • 32 Indicators broken into 5 categories • Magnitude of monthly water condition • Timing of annual extreme conditions • Frequency and Duration of high and low pulses • Magnitude and Duration of a annual extreme conditions • Rate and frequency of water condition change • Drought stress on plants (falling levels) • Entrapment of organisms on islands, floodplains (rising levels) • Desiccation stress on low-mobility streamedge organisms Adapted from: The Nature Conservancy, 2007. Indicators of Hydrologic Alteration Version 7 User's Manual
Background Study Area Data Methods/Analysis Potential Challenges Population data will be used to modify land cover: a proxy for early decades • Ideal: Compare land cover data to stream flow data for each decade back to ~1960’s • Reality: Compare stream gage to land cover where available, use population as a proxy for other time periods
Background Study Area Data Methods/Analysis Potential Challenges Portland 1986 Portland 2006 Establish relationship between stream flow and land cover for available years
Background Study Area Data Methods/Analysis Potential Challenges Portland 1986 Portland 2006 Portland 1993 Portland 2001 Portland 1996 Establish relationship between population change and land cover change Metro Portland Population 1980: 197,938 1990: 221,069 2000: 243,537
Background Study Area Data Methods/Analysis Potential Challenges ~20% increase ~23% increase Establish relationship between population change and land cover change
Background Study Area Data Methods/Analysis Potential Challenges Establish relationship between population change and land cover change To illustrate the point with mock data… If… Biddeford Population 1980 – 2000 = + 20 % Biddeford Developed 1980 – 2000 = +8% Then… Biddeford Population 1960 – 1980 = + 40 % Biddeford Developed 1960 – 1980 = +16% Simple linear relationship (Lopez et al in Mexico)
Background Study Area Data Methods/Analysis Potential Challenges Use population data to modify landcover in the GIS Estimated Development Values Based on Pop. Growth Known Landcover Development Values • Rather than a binary developed / undeveloped classification, class as low, medium and high intensity development (1, 2, 3) • Take the mean score for the watershed of interest (the maximum possible would = 3, where all cells are high intensity development • Multiply developed score by the % established relative to the population change % on a cell-by-cell basis • When developed cells are summarized by watershed, the % change for any given political area will be reflected in the watershed, even when the boundaries are totally different • On the down side, undeveloped areas stay undeveloped. Mean Score = 0.7 Mean Score = 0.45 Auburn + 0.5% Lewiston + 1%
Background Study Area Data Methods/Analysis Potential Challenges Portland 1986 Portland 2006 Portland 1993 Portland 2001 Portland 1996 The modified landcover can then be used to represent years with no other land cover data For example… (using mock data) Portland 1940 Portland 1980
Background Study Area Data Methods/Analysis Potential Challenges Final products will include maps and graphs summarizing results • Watershed – by - Watershed • For each hydrologic characteristic examined, a map depicting study watersheds symbolized by linear regression results • Tables and graphs further detailing these relationships for subject watersheds • Statistical comparison of southern vs. northern watersheds
Background Study Area Data Methods/Analysis Potential Challenges How to account for other variables? • Dam! • Most are older than 1960’s • Most streams with gages have at least 1 (especially in southern Maine) • Accounting for them is beyond the scope of this project and could be a potential future refinement Photo: Friends of Sebago Lake
Background Study Area Data Methods/Analysis Potential Challenges How to account for other variables? • Too much static? • All told, Maine is still relatively undeveloped – will there be a development signature? • Results can not be considered definitive, given the use of population as a proxy for development. • Next steps: historic aerials?
Background Study Area Data Methods/Analysis Potential Challenges References • Lopez, Erna; Gerardo Bocco, Manual Mendoza, Emilio Duau. Predicting land-cover and land-use • change in the urban fringe: A case in Morelia city, Mexico . Landscape and Urban Planning. • Vol 55 Issue 4. August 2001. • Poff, LeRopy, Brian Bledsoe, Christopher Cuhaciyan. Hydrologic variation with land use across • the contiguous United States: Geomorphic and ecological consequences for stream ecosystems. • Geomorphology Vol 79. pp 264-285. 2006. • Richter BD, Baumgartner JV, Powell J, Braun DP. A method for assessing hydrologic alteration • within ecosystems. Conservat Biol 1996;10(4):1163–74.
Questions / Comments? • Thank you!