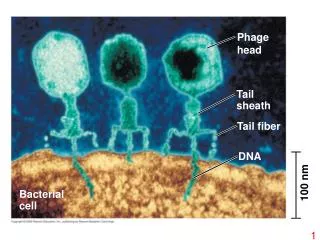
I. Bacterial Cell Division
© 2012 Pearson Education, Inc. I. Bacterial Cell Division. 5.1 Cell Growth and Binary Fission 5.2 Fts Proteins and Cell Division 5.3 MreB and Determinants of Cell Morphology 5.4 Peptidoglycan Synthesis and Cell Division. © 2012 Pearson Education, Inc. 5.1 Cell Growth and Binary Fission.

I. Bacterial Cell Division
E N D
Presentation Transcript
© 2012 Pearson Education, Inc. I. Bacterial Cell Division • 5.1 Cell Growth and Binary Fission • 5.2 Fts Proteins and Cell Division • 5.3 MreB and Determinants of Cell Morphology • 5.4 Peptidoglycan Synthesis and Cell Division
© 2012 Pearson Education, Inc. 5.1 Cell Growth and Binary Fission • Binary fission: cell division following enlargement of a cell to twice its minimum size (Figure 5.1) • Generation time: time required for microbial cells to double in number • During cell division, each daughter cell receives a chromosome and sufficient copies of all other cell constituents to exist as an independent cell
Figure 5.1 Cellelongation One generation Septumformation Septum Completionof septum;formation ofwalls; cellseparation © 2012 Pearson Education, Inc.
© 2012 Pearson Education, Inc. 5.2 Fts Proteins and Cell Division • Fts (filamentous temperature-sensitive) Proteins (Figure 5.2) • Essential for cell division in all prokaryotes • Interact to form the divisome (cell division apparatus) • FtsZ: forms ring around center of cell; related to tubulin • ZipA: anchor that connects FtsZ ring to cytoplasmic membrane • FtsA: helps connect FtsZ ring to membrane and also recruits other divisome proteins • Related to actin
© 2012 Pearson Education, Inc. 5.2Fts Proteins and Cell Division • DNA replicates before the FtsZ ring forms (Figure 5.3) • Location of FtsZ ring is facilitated by Min proteins • MinC, MinD, MinE • FtsK protein mediates separation of chromosomes to daughter cells
Figure 5.2 Outer membrane Peptidoglycan Cytoplasmic membrane Divisomecomplex FtsZ ring Cytoplasmic membrane © 2012 Pearson Education, Inc.
© 2012 Pearson Education, Inc. 5.3 MreB and Determinants of Cell Morphology • Prokaryotes contain a cell cytoskeleton that is dynamic and multifaceted • MreB: major shape-determining factor in prokaryotes • Forms simple cytoskeleton in Bacteria and probably Archaea • Forms spiral-shaped bands around the inside of the cell, underneath the cytoplasmic membrane (Figure 5.4a and b) • Not found in coccus-shaped bacteria
© 2012 Pearson Education, Inc. 5.3 MreB and Determinants of Cell Morphology • MreB (cont’d) • Localizes synthesis of new peptidoglycan and other cell wall components to specific locations along the cylinder of a rod-shaped cell during growth
Figure 5.4a FtsZ Cell wall Cytoplasmicmembrane MreB Sites of cellwall synthesis © 2012 Pearson Education, Inc.
Figure 5.4b © 2012 Pearson Education, Inc.
© 2012 Pearson Education, Inc. 5.3 MreB and Determinants of Cell Morphology • Most archaeal genomes contain FtsZ and MreB-like proteins, thus cell morphology is similar to that seen in Bacteria
© 2012 Pearson Education, Inc. 5.4 Peptidoglycan Synthesis and Cell Division • Production of new cell wall material is a major feature of cell division • In cocci, cell walls grow in opposite directions outward from the FtsZ ring • In rod-shaped cells, growth occurs at several points along length of the cell
© 2012 Pearson Education, Inc. 5.4 Peptidoglycan Synthesis and Cell Division • Preexisting peptidoglycan needs to be severed to allow newly synthesized peptidoglycan to form • Beginning at the FtsZ ring, small openings in the wall are created by autolysins • New cell wall material is added across the openings • Wall band: junction between new and old peptidoglycan
Figure 5.5 FtsZ ring Growth zone Wall bands Septum © 2012 Pearson Education, Inc.
Figure 5.4a FtsZ Cell wall Cytoplasmicmembrane MreB Sites of cellwall synthesis © 2012 Pearson Education, Inc.
© 2012 Pearson Education, Inc. 5.4 Peptidoglycan Synthesis and Cell Division • Bactoprenol: carrier molecule that plays major role in insertion of peptidoglycan precursors • C55 alcohol (Figure 5.6) • Bonds to N-acetylglucosamine/N-acetylmuramic acid/pentapeptide peptidoglycan precursor
© 2012 Pearson Education, Inc. 5.4 Peptidoglycan Synthesis and Cell Division • Glycolases: enzymes that interact with bactoprenol (Figure 5.7a) • Insert cell wall precursors into growing points of cell wall • Catalyze glycosidic bond formation
Figure 5.7a Peptidoglycan Growing pointof cell wall Transglycosylaseactivity Autolysinactivity Cytoplasmicmembrane Out In Pentapeptide Bactoprenol © 2012 Pearson Education, Inc.
© 2012 Pearson Education, Inc. 5.4 Peptidoglycan Synthesis and Cell Division • Transpeptidation: final step in cell wall synthesis (Figure 5.7b) • Forms the peptide cross-links between muramic acid residues in adjacent glycan chains • Inhibited by the antibiotic penicillin
Figure 5.7b Transpeptidation © 2012 Pearson Education, Inc.
© 2012 Pearson Education, Inc. II. Population Growth • 5.5 The Concept of Exponential Growth • 5.6 The Mathematics of Exponential Growth • 5.7 The Microbial Growth Cycle
© 2012 Pearson Education, Inc. 5.5 The Concept of Exponential Growth • Most bacteria have shorter generation times than eukaryotic microbes • Generation time is dependent on growth medium and incubation conditions
© 2012 Pearson Education, Inc. 5.5 The Concept of Exponential Growth • Exponential growth: growth of a microbial population in which cell numbers double within a specific time interval • During exponential growth, the increase in cell number is initially slow but increases at a faster rate (Figure 5.8)
© 2012 Pearson Education, Inc. 5.7 The Microbial Growth Cycle • Batch culture: a closed-system microbial culture of fixed volume • Typical growth curve for population of cells grown in a closed system is characterized by four phases (Figure 5.10): • Lag phase • Exponential phase • Stationary phase • Death phase Animation: Bacterial Growth Curve
Growth phases Exponential Stationary Death Lag Figure 5.10 1.0 10 0.75 Optical density (OD) 9 Turbidity(optical density) Log10 viableorganisms/ml 0.50 Viable count 8 0.25 7 6 0.1 Time © 2012 Pearson Education, Inc.
© 2012 Pearson Education, Inc. 5.7 The Microbial Growth Cycle • Lag phase • Interval between when a culture is inoculated and when growth begins • Exponential phase • Cells in this phase are typically in the healthiest state • Stationary phase • Growth rate of population is zero • Either an essential nutrient is used up or waste product of the organism accumulates in the medium
© 2012 Pearson Education, Inc. 5.7 The Microbial Growth Cycle • Death Phase • If incubation continues after cells reach stationary phase, the cells will eventually die
© 2012 Pearson Education, Inc. IV. Temperature and Microbial Growth • 5.12 Effect of Temperature on Growth • 5.13 Microbial Life in the Cold • 5.14 Microbial Life at High Temperatures
Enzymatic reactions occurringat maximal possible rate Optimum Enzymatic reactions occurringat increasingly rapid rates Figure 5.18 Growth rate Minimum Maximum Temperature Membrane gelling; transportprocesses so slow that growthcannot occur Protein denaturation; collapseof the cytoplasmic membrane;thermal lysis © 2012 Pearson Education, Inc.
© 2012 Pearson Education, Inc. 5.12 Effect of Temperature on Growth • Microorganisms can be classified into groups by their growth temperature optima (Figure 5.19) • Psychrophile: low temperature • Mesophile: midrange temperature • Thermophile: high temperature • Hyperthermophile: very high temperature
Thermophile Example:Geobacillusstearothermophilus Hyperthermophile Hyperthermophile Figure 5.19 Example:Pyrolobus fumarii Example:Thermococcus celer Mesophile Example:Escherichia coli 60° 106° 88° 39° Growth rate Psychrophile Example:Polaromonas vacuolata 4° 20 30 40 50 60 70 80 90 100 110 120 0 10 Temperature (°C) © 2012 Pearson Education, Inc.
© 2012 Pearson Education, Inc. 5.12 Effect of Temperature on Growth • Mesophiles: organismsthat have midrange temperature optima; found in • Warm-blooded animals • Terrestrial and aquatic environments • Temperate and tropical latitudes
© 2012 Pearson Education, Inc. 5.13 Microbial Life in the Cold • Extremophiles • Organisms that grow under very hot or very cold conditions • Psychrophiles • Organisms with cold temperature optima • Inhabit permanently cold environments (Figure 5.20) • Psychrotolerant • Organisms that can grow at 0ºC but have optima of 20ºC to 40ºC • More widely distributed in nature than psychrophiles
© 2012 Pearson Education, Inc. 5.13 Microbial Life in the Cold • Molecular Adaptations to Psychrophily • Production of enzymes that function optimally in the cold; features that may provide more flexibility • More -helices than -sheets • More polar and less hydrophobic amino acids • Fewer weak bonds • Decreased interactions between protein domains
© 2012 Pearson Education, Inc. 5.13 Microbial Life in the Cold • Molecular Adaptations to Psychrophily (cont’d) • Transport processes function optimally at low temperatures • Modified cytoplasmic membranes • High unsaturated fatty acid content
Figure 5.22 © 2012 Pearson Education, Inc.
Figure 5.23 © 2012 Pearson Education, Inc.
© 2012 Pearson Education, Inc. 5.14 Microbial Life at High Temperatures • Studies of thermal habitats have revealed • Prokaryotes are able to grow at higher temperatures than eukaryotes • Organisms with the highest temperature optima are Archaea • Nonphototrophic organisms can grow at higher temperatures than phototrophic organisms
© 2012 Pearson Education, Inc. 5.14 Microbial Life at High Temperatures • Molecular Adaptations to Thermophily • Enzyme and proteins function optimally at high temperatures; features that provide thermal stability • Critical amino acid substitutions in a few locations provide more heat-tolerant folds • An increased number of ionic bonds between basic and acidic amino acids resist unfolding in the aqueous cytoplasm • Production of solutes (e.g., di-inositol phophate, diglycerol phosphate) help stabilize proteins
© 2012 Pearson Education, Inc. 5.14 Microbial Life at High Temperatures • Molecular Adaptations to Thermophily (cont’d) • Modifications in cytoplasmic membranes to ensure heat stability • Bacteria have lipids rich in saturated fatty acids • Archaea have lipid monolayer rather than bilayer
© 2012 Pearson Education, Inc. 5.14 Microbial Life at High Temperatures • Hyperthermophiles produce enzymes widely used in industrial microbiology • Example: Taq polymerase, used to automate the repetitive steps in the polymerase chain reaction (PCR) technique
© 2012 Pearson Education, Inc. V. Other Environmental Factors Affecting Growth • 5.15 Acidity and Alkalinity • 5.16 Osmotic Effects on Microbial Growth • 5.17 Oxygen and Microorganisms • 5.18 Toxic Forms of Oxygen
© 2012 Pearson Education, Inc. 5.15 Acidity and Alkalinity • The pH of an environment greatly affects microbial growth (Figure 5.24) • Some organisms have evolved to grow best at low or high pH, but most organisms grow best between pH 6 and 8 (neutrophiles)
Moles per liter of: pH Example OH H 1 1014 Volcanic soils, watersGastric fluidsLemon juice 101 1013 102 1012 Acid mine drainageVinegar 103 1011 Increasingacidity RhubarbPeaches Acidophiles Figure 5.24 104 1010 Acid soilTomatoes 105 109 American cheeseCabbage 106 108 PeasCorn, salmon, shrimp 107 107 Neutrality Pure water 106 108 Seawater Very alkaline natural soil 105 109 104 1010 Alkaline lakes Increasingalkalinity Soap solutions Alkaliphiles 103 Household ammoniaExtremely alkaline soda lakes 1011 102 1012 Lime (saturated solution) 101 1013 1 1014 © 2012 Pearson Education, Inc.
© 2012 Pearson Education, Inc. 5.15 Acidity and Alkalinity • Acidophiles: organisms that grow best at low pH (<6) • Some are obligate acidophiles; membranes destroyed at neutral pH • Stability of cytoplasmic membrane critical • Alkaliphiles: organisms that grow best at high pH (>9) • Some have sodium motive force rather than proton motive force
© 2012 Pearson Education, Inc. 5.15 Acidity and Alkalinity • The internal pH of a cell must stay relatively close to neutral even though the external pH is highly acidic or basic • Internal pH has been found to be as low as 4.6 and as high as 9.5 in extreme acido- and alkaliphiles, respectively
© 2012 Pearson Education, Inc. 5.15 Acidity and Alkalinity • Microbial culture media typically contain buffers to maintain constant pH
© 2012 Pearson Education, Inc. 5.16 Osmotic Effects on Microbial Growth • Typically, the cytoplasm has a higher solute concentration than the surrounding environment, thus the tendency is for water to move into the cell (positive water balance) • When a cell is in an environment with a higher external solute concentration, water will flow out unless the cell has a mechanism to prevent this
© 2012 Pearson Education, Inc. 5.16 Osmotic Effects on Microbial Growth • Halophiles: organisms that grow best at reduced water potential; have a specific requirement for NaCl (Figure 5.25) • Extreme halophiles: organisms that require high levels (15–30%) of NaCl for growth • Halotolerant: organisms that can tolerate some reduction in water activity of environment but generally grow best in the absence of the added solute
Halophile Halotolerant Extremehalophile Example:Aliivibrio fischeri Example:Staphylococcusaureus Example:Halobacteriumsalinarum Figure 5.25 Growth rate Nonhalophile Example:Escherichia coli 20 10 15 5 0 NaCl (%) © 2012 Pearson Education, Inc.