Microwave Imager TC Applications
210 likes | 374 Views
Jeff Hawkins, Kim Richardson, Mindy Surratt, Tom Lee, Rich Bankert, Joe Turk 2 , Charles Sampson, Jeremy Solbrig, Arunas Kuciauskas, John Kent 3 ,. Microwave Imager TC Applications. Naval Research Laboratory, Monterey, CA 2 Jet Propulsion Laboratory, Pasadena, CA

Microwave Imager TC Applications
E N D
Presentation Transcript
Jeff Hawkins, Kim Richardson, Mindy Surratt, Tom Lee, Rich Bankert, Joe Turk2, Charles Sampson, Jeremy Solbrig, Arunas Kuciauskas,John Kent3, Microwave Imager TC Applications Naval Research Laboratory, Monterey, CA 2Jet Propulsion Laboratory, Pasadena, CA 3Science Applications Inc. International, Monterey, CA International Workshop on Satellite Analysis of Tropical Cyclones (IWSATC) Honolulu, HI April 15, 2010
Apparent LLCC True LLCC Exposed LLCC Sheared Convection
Good central mass Remove doubt Large rain-free eye Rainband structure
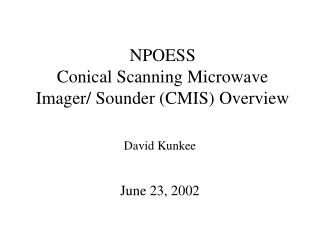
Scatterometer & CloudSat Vis/IR imagery suite Storm Basins & Names Latest 1-km Visible/IR imagery (GEO/LEO) 30 minute MTSAT refresh with AVHRR/OLS as available Microwave imager/sounder product suite Automated Tropical Cyclone Forecasting (ATCF) System warning graphic http://www.nrlmry.navy.mil/TC.html FNMOC: https://www.fnmoc.navy.mil/tcweb/cgi-bin/tc_home.cgi
Microwave Imager Temporal Changes Katrina 512 km
Microwave Imager Temporal Changes Tropical Cyclone Yasi 14 deg
Microwave Imager Temporal Changes Concentric Mode 1: Evolve into one larger diameter eye 512 KM
NW NOAA 43 1430-1520Z 10,000’ North TMI Tb TMI 85H 9-22-05 1443Z Satellite – Aircraft Comparisons Flt level wind
COMET Module – TC Microwave http://meted.ucar.edu/npoess/ocean_winds/index.htm TC specific focus with microwave sensors Courtesy: Tom Lee
Microwave Imager Training http://www.nrlmry.navy.mil/training-bin/training.cgi
Automating TC Intensity??? Huge-Intense Shear - Weak Annular - Intense Wrapping Small-Intense Wrapping?
Microwave Imager TC Intensity Estimation Microwave imager data provides structural characteristics not always found in typical Vis/IR imagery. GOES Visible SSM/I 85 GHz Machine Learning Application Leave-One(TC)-Out Cross Validation Training and Testing Image feature extraction Feature selection to reduce redundant and irrelevant features Atlantic Basin Data Set **319 samples from 60 TC’s** RMSE: 13.1 kts Segmented 85 GHz Courtesy: Rich Bankert
Microwave Imager Top Impact “Features” 1. Symmetry measure – based on the 2-deg radius gradient vector angles relation to center 2. Average % encirclement of 1-km wide rings within 1-deg radius area (pixels < 253 K) 3. Difference in Tb of warmest center pixel and coldest surrounding pixel 4. Summation of pixel Tb in the SE quadrant of the “eye” region 5. Average of the maximum Tb on each ring in the 1-degree radius area 6. Area coverage of pixels with less than 228 K Tb 7. Number of 1-km rings (within 1-deg radius) with at least 33% pixels with < 253 K Tb 8. Average % encirclement of the 1-km wide rings within 1-2-degree radius (pixels < 253 K) 9. Maximum summation of pixel Tb values along a 1-km ring for pixels with < 228K Tb 10. Number of 1-km rings (within 1-deg radius) with at least 50% pixels with Tb < 253 K
Ritchie: Gradient Vector Feature Artificial Vortex Gradient Detail IR Image Gradient Detail
TC Intensity – Microwave Imager Automated Microwave Imager TC Intensity Estimates 319 Atlantic basin samples [1995-2005] Features computed from SSM/I 85 GHz channel data RMSE (kts) • Cubist (machine learning tool) Cross Validation (CCV) - all original features 21.0 20.0 • CCV - new feature set (modified original, new features added) 19.0 18.0 • Manual estimation (Jeff) • CCV -feature selection (remove redundant and irrelevant features) 17.0 • Manual estimation (Jeff) • CCV -newfeatures added to total set, re-do feature selection 16.0 • CCV -277 samples - high shear samples removed, re-do feature selection (Jeff RMSE – 16.7 kts) 15.0 14.0 • CCV - 319 samples – add gradient vector (Ritchie) feature 13.0 12.0 TIMELINE
Problematic TC Structure Cases SSM/I 85 GHz images (BT) High Shear Center Convection Dying Inner Eye
TC intensity – Microwave Imager (2006-2009 Data Sets) Adding Near Real-Time Data Sets from NRL-TC Web Page Includes AMSR-E, TMI, SSMIS in addition to original SSM/I
37 GHz H-pol 85 GHz H-pol 37 GHz H-pol 85 GHz H-pol TC intensity – Microwave Imager (Adding 37 GHz Data) Typhoon Sinlaku (15W) Tropical Cyclone Yasi (11P)
91 GHz H-pol F-17 SSMIS 0750Z Microwave Channel Intercalibration 85 GHz H-pol 89 GHz H-pol F-15 SSM/I 0723Z Aqua AMSR-E 0332Z Colder Tb at higher frequencies imply stronger storm: Incorrect
AMSR-E 89 GHz H TMI 85 GHz H 8-10 K Differences In Deep Convection TMI 85 GHz H - AMSR-E 89 GHz H Passive Microwave Channel Intercalibration Process Hurricane Bonnie TB Simulations • Huge potential to create issues: • Qualitative assessments • Quantitative analyses (intensity alg)
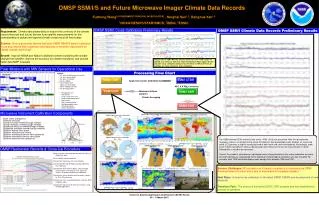
Passive Microwave Imager Missions Megha Tropiques MADRAS GCOM AMSR GPM DWSS-1 Extended mission Primary mission Future Launches Satellite sensors soon to cease functioning March 2011 Hawkins