Download
1 / 21
210 likes | 237 Views
National Water Quality Monitoring Network: Estuaries by Jawed Hameedi, NOAA. National Monitoring Conference San Jose, CA May 9, 2006. A Water Quality Monitoring Network design Conceived as a Network of Networks – does not replace existing programs Provides comprehensive national coverage

E N D
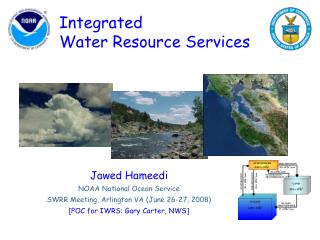
National Water Quality Monitoring Network: Estuaries by Jawed Hameedi, NOAA National Monitoring Conference San Jose, CA May 9, 2006
A Water Quality Monitoring Network design • Conceived as a Network of Networks – does not replace existing programs • Provides comprehensive national coverage • Encompasses observations from the upland to the coasts and the coastal ocean • Offers linkage with IOOS • Raises the bar by promoting: • data standards and quality assurance parameters and assures data comparability • data management and access
Follow-up to the design Compare design with existing programs • Include • Improve • Define as external An example • Network specifies 258 sampling sites at downstream points of HUC-6 basins • 222 stream gauge sites (86 percent) are already in place
PacificOcean Coos Bay South Slough NERR A continuum of Observations • Estuaries • Nearshore • Offshore and EEZ • Great Lakes • Coastal Beaches Wetlands With Flow and Flux from • Rivers (HUC6) • Coastal streams • Atmosphere • Groundwater
Network Estuaries • 149 estuaries • NOAA-defined estuaries – 138 (conterminous US) • 92 in 1985 (over 90% of total surface area and over 90% of total freshwater flow) – NEI Project • 112 in 1990 • 138 in 1999 • Include coastal bays and fjords as well • 18 in California • All 138 have data on estuarine drainage area, digitized boundaries, surface area, flushing rates, human use, etc.
Nested Sampling Design: “condition” of estuaries • Generalized random tessellation stratified (GRTS) survey design • U.S. estuaries (50 per IOOS region) • An estuary (50 per estuary) • Parts (north, south, etc.) • Uses (urban, harbor, industrial, rural, etc.)
Estuaries: Sampling Scheme • Condition of US estuaries: 50 sites per IOOS region • Condition of individual estuaries: 50 sites per estuary • Transport through estuaries (for investigating cause-effect relationship, focusing on estuary-specific resource management issues or scientific questions): 15 sites per estuary – RAs • Short-term variability (likely using moored instruments): 2 sites per estuary -- RAs
WQ characteristics (t, S, pH, color, etc.) “Bulk” organics (oil and grease, organic wastes, deoxygenating substances) Nutrients, chlorophyll Major ions (in freshwater) Metals (Cu, Zn, Pb, Hg) and metalloids (As, Se) Chlorinated pesticides, other agrochemicals PAHs and halogenated hydrocarbons (e.g., PCBs) “New contaminants” (Pharmaceuticals, PBDEs, PFOS, detergents, lubricants) Water Quality Measurements
Satellite imagery • Surface wind fields (speeds and direction) • Ocean surface topography • Altimeters on satellite routinely provide wide-swath information (on sea level) • Space-based SST • Sea surface temperature measurements are routine • Ocean color and chlorophyll – interpretation issues • Sea ice distribution and volume (relates to AK)
Measurements from buoys and gliders • Sea surface winds • Surface atmospheric pressure • Wave height and direction • Sea level • Surface and interior field of: • Ocean currents – Acoustic Doppler Current Profilers (ADCPs) are now quite common • Temperature – nearly all buoys have sensors • Salinity – nearly all buoys have sensors • Dissolved oxygen – routine measurements likely • Selected nutrients (e.g., nitrate) – routine measurements likely • Chlorophyll – routine measurements likely • pCO2 – such measurements using moored instruments have been taken since late 1960s. (need these data for ecological shifts, biological production, upwelling, mixing, climate change, etc.)
Measurements from shipboard surveys • CTD records • ADCP profiles • Dissolved oxygen • Nutrients, chlorophyll, water transparency • LMR assessment surveys • Etc.
Monitoring Offshore Waters: Remote observations (shore), satellite sensors, buoys, ships and Autonomous Underwater Vehicles
Monitoring Framework:Focus on Management Issues and Questions • Fish consumption advisories • Shellfish bed closure • Toxic chemicals • Hypoxic conditions • What is the spatial extent? (What fraction? Continuous? Patchy?) • What is the temporal trend? (Seasonal, Yearly, Decadal) • What factors are responsible for low oxygen conditions? (bulk organics/BOD, retarded mixing, altered circulation) • Beach closures
Integrating observations, research and modeling • Accessibility of data from varied sources • Targeted observations and sampling • Derive input parameters and coefficients • Interior test points for the model domain • Verify model outputs • Offer broad geographical coverage and synoptic observations • Inference about hidden variables or relationships
Network Data Management • Built on ACWI Water Quality Data Elements • purpose, content, metadata • Assumes USGS and EPA data warehouses • Provides for data access and discovery • Web services; hypertext and XML protocols • Assures interoperability and transport – download • Will be consistent with IOOS/DMAC standards
Data Uses and Products • Data and information to produce periodic, comprehensive reports: • An assessment of the water quality and health of the Nation’s coastal ecosystems • An evaluation of water quality trends • Identification of sources of degraded water quality resulting in impaired products (e.g., fish) and services (e.g., recreation) • An assessment of government programs designed to abate the degradation of coastal ecosystems • A database for identifying and evaluating uniform indicators of coastal water quality and ecosystem health
Water Quality Issues:Delaware Bay • Dredging impacts • Altered hydraulic geometry: increased mean depth (1.5m); 17% percent increase in sub-tidal volume of estuary • Widespread bottom and marshland erosion and sediment removal from non-dredged areas (3x flux from rivers) • Freshwater quantity and quality – drinking water • Assuring public health (beach contamination; seafood consumption advisories) • Loss of habitat or population decline in key species (e.g., Eastern oyster; horseshoe crab; American shad) • Nitrogen overload and nutrient imbalance
Delaware Estuary Watershed to Ocean Observing System (DEWOOS) • Inventory existing assets • Build web-based interface • Build upon DBOS • Link NWQMN with IOOS • Implement DEWOOS • Galvanize MACOORA
Thank you! The scientific observation of Nature keeps us in close contact with the behavior of Reality, and thus sharpens our inner perception for a deeper vision of it. Allama Muhammad Iqbal (1877-1938) Slides courtesy: USGS, US FWS, MBARI, Rutgers and Sheefishgraphics