Download
1 / 26
260 likes | 325 Views
Explore the evolution of water laws in Texas, from the 1980s to present, and the challenges in implementing environmental flow regulations. Learn about Senate Bills 1, 2, and 3 and the intricacies of assessing water withdrawals on river ecosystems. Dive into methodologies for determining flow conditions in Texas rivers, instream flow data collection, and the role of TCEQ in setting standards. Discover the complexities of ecological studies and the River Continuum Concept in maintaining water quality.

E N D
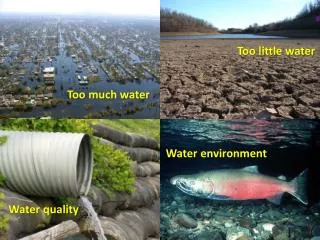
Too little water Too much water Water environment Water quality
Texas Legislative Background • Freshwater inflow needs for bays & estuaries (1980s) • Senate Bill 1: water resource planning & management (1997) • Senate Bill 2: the science bill (2001) • Instream flow data collection and evaluation program • Methodologies to determine flow conditions in Texas rivers and streams necessary to support a sound ecological environment • Senate Bill 3: the implementation bill (2007) • The who, when, and how of eflowimplementation in Texas • TCEQ must adopt the recommended standards by June 2011
? 3D stream Blue Line The study of ecology requires (and adds) complexity and nuance The real thing
River Continuum Concept Flow Biota Habitat
Rate of Change Magnitude Duration Timing the natural flow regime Not depicted: frequency
flow components (NRC 2005)
An Environmental Flow Regime www.tceq.com
Data Sources TCEQ Water Rights Points USGS Gages NHDPlus
TCEQ’s NeedWater Withdrawals Not Near Gages How to assess the contribution of a withdrawal on a tributary to an environmental flow defined on the main stem river?
Trinity River Branches Drainage Area = 2459 sq. miles Elm Fork Drainage Area = 6106 sq. miles West Fork Trinity River
Mean Annual Flows Elm Fork, 46% flow West Fork, 54% flow Trinity River
Elm Fork Attributes Length = 28.39 km Mean Flow = 670 cfs Mean Velocity = 1.52 ft/sec Max Elev = 130.93 m Min Elev = 121.25m Slope = 0.34m/km or 0.034%
Trinity River Attributes Length = 9.39 km Mean Flow = 1493 cfs Mean Velocity = 1.86 ft/sec Max Elev = 121.25 m Min Elev = 118.78m Slope = 0.26m/km or 0.026%
Finding Pulse Lag Times in WiSKI 12 Hours Trinity River at Dallas Elm Fork of Trinity River at Carrollton, 12 hours earlier Two time scales Image courtesy of Matt Ables, Kisters
Wave Celerity vs. Flow Velocity • Wave celerity = 5/3 * flow velocity Good agreement between travel time based on kinematic wave celerity and that based on time series data comparisons in Wiski.
Muskingum-Cunge Method Kinematic wave plus some dynamic wave effects
Muskingum-Cunge X Parameter Trinity River Elm Fork
Muskingum-Cunge Method in HEC-HMS HEC-HMS Model of Brushy Creek in Round Rock HEC-HMS