MATPLOTLIB PART 3
Matplotlib offers the facility to plot the graphs. Here is a glance over different special plots that can be plotted using Matplotlib.<br>To learn more visit:https://bit.ly/DatascienceCourse<br><br>

MATPLOTLIB PART 3
E N D
Presentation Transcript
MATPLOTLIB ( PART 3 )
Scatter Plot • Eg: n = 256X = np.random.normal(0,1,n) Y = np.random.normal(0,1,n) plt.scatter(X,Y) • O/P:
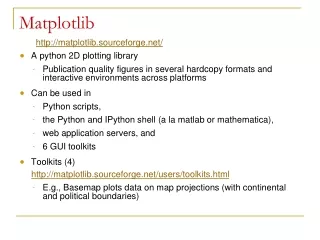
Usually we do not use matplotlib for the special plots as it has some limitations.Hence we go for a higher version of tool that is Seaborn. • Still we can plot various plots at basic level in matplotlib as well.Some of the plots that can be plotted are: • Scatter plot • Histogram • Box-plot • Bar plot
Eg 2: • arr1 = np.arange(1,10,0.5)arr2 = np.log(arr1)plt.scatter(arr1,arr2) • O/P:
Histogram • arr1 = np.arange(1,10,0.5)arr2 = np.log(arr1) plt.hist(arr1, arr2) • O/P:
Box-Plot • bplt = plt.boxplot(arr1, vert = True,patch_artist = True)patch, color = list(zip(bplt['boxes'],['pink']))[0]patch.set_facecolor(color) • O/P:
Pie Chart • Z = np.random.uniform(0, 1, 20)plt.pie(Z) • O/P: • These are some of ways of plotting different graphs in Matplotlib . Due to the facilities of Seaborn over Matplotlib, seaborn id always preferred.