Download
1 / 28
280 likes | 460 Views
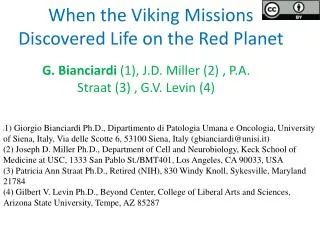
When the Viking Missions Discovered Life on the Red Planet . ( 1) Giorgio Bianciardi Ph.D. , Dipartimento di Patologia Umana e Oncologia, University of Siena, Italy, Via delle Scotte 6, 53100 Siena, Italy (gbianciardi@unisi.it)

E N D
When the Viking Missions Discovered Life on the Red Planet (1) Giorgio BianciardiPh.D., Dipartimento di Patologia Umana e Oncologia, Universityof Siena, Italy, Via delle Scotte 6, 53100 Siena, Italy (gbianciardi@unisi.it) (2) Joseph D. Miller Ph.D., Department of Cell and Neurobiology, Keck School of Medicine at USC, 1333 San Pablo St./BMT401, Los Angeles, CA 90033, USA (3) Patricia Ann Straat Ph.D., Retired (NIH), 830 Windy Knoll, Sykesville, Maryland 21784 (4) Gilbert V. Levin Ph.D., Beyond Center, College of Liberal Arts and Sciences, Arizona State University, Tempe, AZ 85287 G. Bianciardi(1), J.D. Miller (2) , P.A. Straat (3) , G.V. Levin (4)
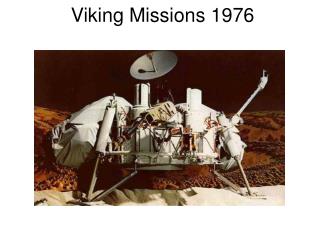
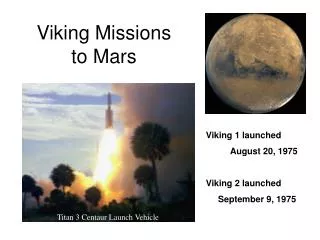
BACKGROUND The two Viking landers dropped on Mars about 4,000 miles apart, in 1976. They scooped up soil samples and applied a radiolabeled nutrient cocktail to the soil (Labeled Release, LR, Experiment, G.V. Levin Principal Investigator)
BACKGROUND If microbes were present in the soil, they would likely metabolize the nutrient resulting in the release of CO2 or possibly methane (CH4).
Life on Mars ! In effect, the active experiments did indicate the release of a carbon-containing gas.
Life on Mars ! ..and control experiments on sterilized soil samples produced little or no gas release.
No organiccompunds? No life! But the Viking GCMS (gas chromatograph–mass spectrometer) experiment, that carried out a search for organic compounds, did not find any organic molecules in the soil
No organiccompunds? No life! Most scientists suggested that the release was the result of chemical reactions with highly reactive compounds such as superoxides and peroxides. The NASA scientists let the matter drop. Chemistry NOT Biology!
But, in 2001.. Glavin D.P. et al., 2001 The Viking GCMS was not able to detect the pyrolysis products of <106Escherichia colibacteria/g. (while the LR experiment was able to detect 10 bacteria/g) Earth and Planetary Science Letters Volume 185, Issues 1–2, 15 February 2001, 1–5 Detectingpyrolysisproductsfrombacteria on MarsDaniel P. Glavin, Michael Schubert, Oliver Botta, Gerhard Kminek, Jeffrey L. Bada
moreover, in 2001.. Miller, J.D., 2001 The Viking Lander LR experiments showed highly periodic gas release. The signal itself had a circadian period of 24.66 hours, the length of a Martian day. Circadianrhythm = Biology? Lacking the smoking gun
Miller, J.D., 2001/ QUESTION #1 forus: But the fluctuations in gas emissions seemed to be entrained to a 2°C fluctuation inside the Viking Lander (fluctuation in temperature that occurs daily on the surface of Mars, can be as much as 100°C). If the circadian rhythm was simply driven by temperature it was probably Chemistry. Driven or not driven? Chemistry or Biology? Lacking the smoking gun
Phoenix, 2008 descovering The Phoenixlander descended on Mars on May 25, 2008 Perchlorate on Mars
Perchlorate can destroy organics when heated (as in GCMS) and produce chloromethaneand dichloromethane, the identical chlorine compounds discovered by GCMS on Mars 2010 Atacama desert (itcontains organic Compounds and perchlorate!)GCMS = NO org. comp.if perchlorates are present.
LR Experiment: a newapproach. Complexityanalysis: order and chaos Destructuredrandomness: White noise Order: a sinefunction LIFE: Heartbeat: chaos, randomness and fractal (statistical) order
Complexityanalysis: LR data, Mars vs. Biological data sets, Earth: the samebehaviour? (Question # 2) LIFE: Heartbeat: chaos, randomness and fractal (statistical) order
ReanalysisofViking LR experimentsstarts . Bianciardiwith Miller, Straat& Levin: #9 experiments on Mars (active, sterilized, starved, protected.) 16 000 data points, and severalbiologicalcontrols, (bacteria on soilsamples, temperature ofrats) 2004-2011.Using 7 nonlinearindices, Chaos Data Analyzer sw.
Relative Lempel-Ziv complexity, LZ Relative LZ complexity is a measure of the algorithmic complexity of a time series (Lempel and Ziv 1976). According to the Kaspar and Schuster algorithm, each data point is converted to a single binary digit according whether the value is less than, or greater than, the median value of a set of data point
The Hurst exponent is the slope of the root-mean-square . Hurst exponent, H The Hurst exponent is the slope of the root-mean-square displacement of each data point versus time. The amountof“memory” in a timeseries
Largest Lyapunov exponent, Lyapunov exponents measure the rate at which nearby trajectories in phase space diverge.
Entropy, K (Kolmogorov): The entropy index chosen here (Grassberger and Procaccia 1983b), is a measure of the disorder in a data set, and was calculated as the sum of the positive Lyapunov exponents. BDS (Brock-Dechert-Scheinkman) statistic Brock-Dechert-Scheinkman statistic detects serial dependence in time series and can thereby quantitate the deviation of the data from pure randomness Correlation time, τ: A measure of how dependent data points are on their temporal neighbours. It is taken as the time at which the correlation function first falls to 1/e
16,000 data points. Allsols on Mars. The resultspublished some months ago. Int. J. of Aeronautical & Space Sci. 13(1), 14–26 (2012) Complexity Analysis of the Viking Labeled Release Experiments Giorgio Bianciardi, Joseph D. Miller, Patricia AnnStraat, Gilbert V. Levin K-means cluster analysis automatically sorted the active Viking LR experiments data (Mars), averaged across all sols, with known biological measures (soil sample with known microbial content, terrestrial rat core temperature data series), p<0.001.
Int. J. of Aeronautical & Space Sci. 13(1), 14–26 (2012) Complexity Analysis of the Viking Labeled Release Experiments Giorgio Bianciardi, Joseph D. Miller, Patricia Ann Straat, Gilbert V. Levin The set of complexity measures unambiguously distinguish the active LR experiments on Mars from various abiotic controls (p<0.001)
Int. J. of Aeronautical & Space Sci. 13(1), 14–26 (2012) Complexity Analysis of the Viking Labeled Release Experiments Giorgio Bianciardi, Joseph D. Miller, Patricia Ann Straat, Gilbert V. Levin A perfect test todistinguishbiologyfromabioticprocesses? It's not the matter, Look…
Materials and Methods Hereweconsider : 4 LR experimentsperformedby the Vikings on Marsadding a solutionof formate, glycine, glicolate, D- L- Lactate, D- L- Alaninelabeledwith 14C. And 1 LR experimentperformed on Earth, terrestrialsoilwith a knownmicrobialpopulation, using the same LR nutrient The amountofradiolabeled gas releasedduring the first 6 sols (Mars) or 6 days (Earth),readevery 16 minutes, wasanalyzedbyChaos Data Analyzer Pro, ( Sprott & Rowlands, American IstituteofPhysics) todetermine : - L-Z , Hurst, Lyapunov, Entropy, BDS, indices.
First sixsols on Mars. Walkingthrough the complexityvariables 1)Temperature and CO2 fluctuations 2) LR activetest (Vl2C1) Mars Vs. Earth (bacteria) A two-tailed independent t test showing how temperature and radio-labeled gas differ (p<0.001), while the complexity indices of radiolabeledgas on Earth (bacteria) and Mars were superimposable. The temperature didn’t drive the CO2 fluctuations (do you remember? Question #1) Bacteria (Earth) and data from Mars: the SAME indices(Question #2)
First six sols on Mars. Walking through the complexity variables Sterilization, Mars vs. Earth Complexity of radiolabeledgas on Earth or Mars after sterilization showed changes of nonlinear indices SUPERIMPOSABLE(Question #2)
First sixsols on Mars. Walking through the complexity variables 4 active LR tests, Mars Vs. Earth (Bacteria) Complexity of radiolabeledgas on Earth (bacteria) or Mars (4 active tests) are seen to be superimposable. The SAME statistical universe.
CONCLUSIONS Question #1.The temperature DIDN’T DRIVE the CO2 fluctuations. The circadian rhythm evidenced by Miller et al (2001) indicated the presence of LIFE Question #2. All the complexity indices were SUPERPOSABLE on Mars and on Earth (soil sample with bacteria). The CO2 release on Mars after adding nutrients was a sign of LIFE. ..or do you prefer to think that on Mars there is some fantastic chemistry that mimics perfectly a bacterial metabolism?
We are now waiting to see if Curiosity finds organic compounds.. SAM (for Sample Analysis at Mars Sample Analysis At Mars (SAM) SAM (Sample Analysis at Mars): tosearchorganiccompounds