Download
1 / 23
230 likes | 370 Views
Anthropogenic Impacts on Organic Aerosol during the 2007 BAQS-Met Field Study. Craig Stroud, Michael Moran, Paul Makar, Junhua Zhang, Wanmin Gong, Sunling Gong, Jeff Brook Air Quality Research Division, Environment Canada Jonathan Abbatt, Jay Slowik, Steve Sjosted

E N D
Anthropogenic Impacts on Organic Aerosol during the 2007 BAQS-Met Field Study Craig Stroud, Michael Moran, Paul Makar, Junhua Zhang, Wanmin Gong, Sunling Gong, Jeff Brook Air Quality Research Division, Environment Canada Jonathan Abbatt, Jay Slowik, Steve Sjosted University of Toronto, Department of Chemistry CMAS, 2009
Outline • Motivation • AURAMS description • Model evaluation for STN sites • Model evaluation for BAQS-Met supersites • “Zero out” sensitivity runs • OA/CO ratios • Conclusions
Motivation • Sources of organic aerosol (OA) are poorly understood (primary vs. secondary, anthropogenic vs. biogenic). • Air quality models do not reproduce the high levels of OA observed in polluted environments. • Recent measurements suggest rapid growth of oxygenated OA occurs in urban plumes (e.g. NEAQS,MILAGRO). SVOCs and IVOCs are postulated to be important precursors to this rapid production.
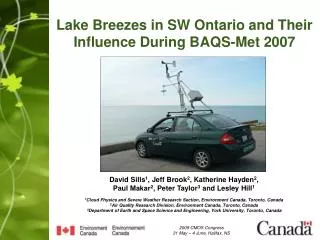
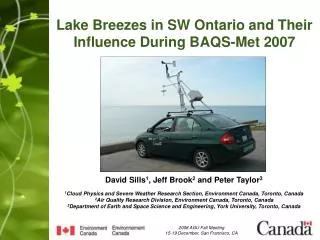
BAQS-Met Study (summer 2007) • Border Air Quality and Meteorology Study provided an opportunity • to examine SOA production in the Detroit/Windsor air shed and plume.
A Unified Regional Air-Quality Modelling System (AURAMS) National Emission Inventories (Cdn, U.S.) Population data Econometric data Land-use data Geophysical data Meteorological observations (OA) SMOKE point mobile area biogenics GEM/GEM-LAM (prognostic meteorological model) Regional PM Model (CHRONOS+ADOM+CAM+new) Advection/diffusion (of 29 gaseous and 8x12 aerosol tracers) , emission (including gaseous precursors and size-segregated and chemically-resolved PM), dry deposition of gaseous tracer, coupled gaseous, aqueous-phase, aerosol/heterogeneous chemistry, secondary organic aerosol formation, aerosol microphysics (nucleation, condensation/evaporation, coagulation,CCN activation), size-dependentscavenging/wet deposition, size-dependent dry deposition of aerosols, gravitational settling/sedimentation. PM2.5, PM10, etc., Concentration Fields
SOA Formation in AURAMS • SOA precursors include TOLU, AROM, BENZ, ALKA, ALKE, IVOCs, PINE, ISOP, SESQ. • SOA yields for each VOC precursor are calculated as a function of organic aerosol loading and temperature (updated to literature yields as of 2008). • IVOC emissions calculated as 1.5x POA emissions (as in Robinson et al., Science, 2007). IVOCs are assumed to react with OH and form SOA in one reaction step (upper limit). • POA emissions were modified to represent volatility at grid-scale concentrations (75% went to SOA and 25% remained as POA). This split was calculated using the volatility basis set parameterization (Robinson et al., Science, 2007) at a representative OA grid cell loadings of 10 g/m3. Assume volatilization and re-condensation is a sub-grid scale process. • SOA yields are also calculated depending on the grid-cell VOC/NOx regimes. Incremental increase in SOA mass calculated from yields under high NOx and low NOx conditions; actual incremental increase is calculated from a linear interpolation between limits based on the fraction of RO2 radicals which react with NOx vs HOx. • Algorithm is computationally efficient and can be used in an operational air quality model
STN Comparison “urban sites” 15km resolution ● Improved bias and error
Differences between AMS OOA at Harrow and Bear Creek NNW flow from Sarnia to Bear Creek SW flow from Detroit to Bear Creek NW flow from Detroit to Harrow
AURAMS SOA at Harrow and Bear Creek ●AURAMS generally captures transition from a clean air mass to a regionally polluted air mass over the 5-day period AURAMS misses the differences between the sites at Harrow peak AURAMS predicts multiple peaks at Bear Creek on July 4 and a broad peak on July 5
Map of AURAMS SOA Predictions on July 4, 2007 (13-17Z) Flow from Detroit/Windsor goes out over Lake St. Clair where SOA production continues before arriving at Bear Creek
Zero VOC Precursor Pathways to SOAat Bear Creek ● IVOC, PINE and AROM are all important precursors for July 4 event ● Regionally polluted air mass on July 7 was biogenic in origin
July 4 Precursor Contributions to SOA:Blue is Biogenic and Red is Anthropogenic 70-80% Anthro. SOA ● Background air from the mid-west U.S. ● Values close to unity represent anthropogenic-dominated SOA (e.g. Toronto)
AURAMS SOA at Harrow and Bear Creek ●AURAMS generally captures transition from a clean air mass to a regionally polluted air mass over the 5-day period AURAMS misses the differences between the sites at Harrow peak AURAMS predicts multiple peaks at Bear Creek on July 4 and a broad peak on July 5
Maps for AURAMS SOA on July 6 (18-21Z) High background entering domain ● In the model, the Detroit/Windsor plume goes east of Harrow due to influence of the lake breeze. Difficulty in capturing urban plumes with model.
July 6: Precursor VOC Contributions: Blue is Biogenic and Red is Anthropogenic Background air was biogenic Mixed sources in study area
OA/CO ratio as a measure of extent of urban VOC processing to form SOA (de Gouw et al., 2008) ICARTT data de Gouw 2005 de Gouw 2008 Empirical parameterization to fit NEAQ 2002 data for urban plume aging of ΔOA/ Δ CO ratios Max ~0.07 ug/m3/ppbv after several days of processing
SOA/CO ratio as a measure of extent of urban VOC processing to form SOA (de Gouw et al., 2008) Harrow average age=17 hr (from TOLU/BENZ) Eq. (5) Δt=17 hr primary ● Large spread to the model correlation
Harrow data shows higher AMS OM than predicted by the de Gouw parameterization AMS AURAMS Harrow average age=17 hr (from TOLU/BENZ) Harrow average age=14 hr (from TOLU/BENZ) Eq. (5) Δt=14 hr Eq. (5) Δt=17 hr primary primary Some large slopes not consistent with de Gouw parameterization
Harrow background concentrations change due to biogenic regional event biogenic slopes primary slope AMS AMS OM and CO correlation shows periods with different slopes representing: - biogenic SOA production (steepest slopes) are consistent with Slowik et al (2009) - anthropogenic SOA production (intermediate slopes) - primary emission (lowest slope)
July 4: max OA/CO ratios in modelled urban plume at Bear Creek near 0.07 ug/m3/ppbv (13-23Z) Cleaner background ● CO distribution shows a max for areas of local emissions (e.g. Detroit, Sarnia). ● SOA distribution is complex with urban-scale to regional-scale production (<1 day) ● OA/CO is a measure of SOA production as the urban air mass ages ● Slope of 0.07 ug/m3/ppbv (70 ug/m3/ppmv) is consistent with de Gouw parameterization
Conclusions • urban SOA enhancement in Detroit/Windsor plume measured at Bear Creek was ΔSOA~10 g/m3 on July 4 (relative to Harrow) • Model captured urban plume SOA at Bear Creek; IVOCs, PINE and AROM were all important VOC precursors. Model OA/CO ratios consistent with de Gouw parameterization on July 4. IVOC contribution is an upper limit estimate. • Model missed urban plume on July 6 at Harrow due to influence/complexity of lake breeze circulation • Measured OA/CO ratios at Harrow were much higher than the de Gouw parameterization on July 6 suggesting Harrow was influenced by mix of biogenic and anthropogenic sources
Thank you for your attention! craig.stroud@ec.gc.ca