Download
1 / 29
290 likes | 460 Views
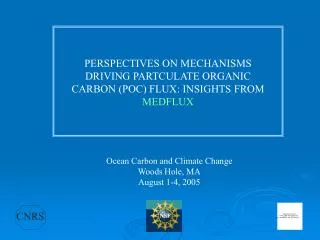
Organic Carbon Aerosol: Insights from the ACE-Asia and ICARTT field campaigns. Colette L. Heald (heald@atmos.berkeley.edu) Daniel J. Jacob, Rokjin J. Park, Solène Turquety, Rynda C. Hudman, Rodney J. Weber, Rick Peltier, Amy Sullivan, Lynn M. Russell

E N D
Organic Carbon Aerosol:Insights from the ACE-Asia and ICARTT field campaigns Colette L. Heald (heald@atmos.berkeley.edu) Daniel J. Jacob, Rokjin J. Park, Solène Turquety, Rynda C. Hudman, Rodney J. Weber, Rick Peltier, Amy Sullivan, Lynn M. Russell Barry J. Huebert, John H. Seinfeld, Hong Liao Stony Brook University April 26, 2006
RADIATIVE FORCING OF CLIMATE Biogenic OC currently not included in forcing estimates is it important?
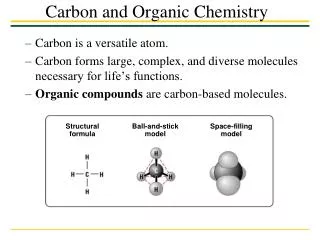
ORGANIC CARBON AEROSOL *Numbers from IPCC [2001] Secondary Organic Aerosol (SOA): 8-40 TgC/yr Reactive Organic Gases OC Nucleation or Condensation Oxidation by OH, O3, NO3 FF: 45-80 TgC/yr BB: 10-30 TgC/yr Monoterpenes Aromatics Direct Emission Fossil Fuel Biomass Burning BIOGENIC SOURCES ANTHROPOGENIC SOURCES
MEASURING OC IN THE ATMOSPHERE CHALLENGE: To measure suite of compounds classified as organic carbon Filter samples: Need to correct for volatilization of particles (negative artifact) and adsorption of gas-phase organics (positive artifact) Ambient Air Denuder to remove gas-phase organics Backup (#2) (to capture OC evaporated from filter #1) Quartz Filter (#1) Thermal Optical analysis to determine OC Concentration
DISTINGUISHING SOA FROM POA: EC/OC RATIO Example from Pittsburg Air Quality Study [Cabada et al., 2004] EC/OC ratio for primary emissions are well-correlated (triangles). Deviations from the slope are indicative of a secondary OC source (squares). • Uncertainties: • changing EC/OC emission ratios for sources • mixing of air masses
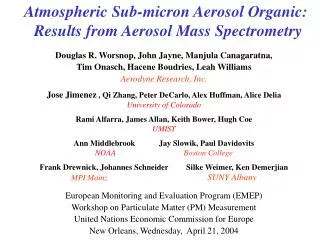
DISTINGUISHING SOA FROM POA:AEROSOL MASS SPECTROMETER (AMS) m/z 57: hydrocarbon like organic aerosol POA m/z 44: oxygenated organic aerosol SOA Reduce complexity of observed spectra to 2 signals: ~2/3 of OC is SOA (in urban site!) [Zhang et al., 2005]
FIRST SUGGESTIONS OF HIGH ORGANIC CARBON AEROSOL CONCENTRATIONS IN THE FREE TROPOSPHERE High organic loading in the FT High organic loading in the UT TARFOX (E US) [Novakov et al., JGR, 1998] Single particles over NA [Murphy et al., Science, 1998]
What is the source of this FT organic carbon aerosol? Mean Observations Mean Simulation (GEOS-Chem global CTM) Observations + ACE-ASIA: OC AEROSOL MEASUREMENTS IN THE FREE TROPOSPHERE (ACE-Asia aircraft campaign conducted off of Japan during April/May 2001) Seinfeld group Huebert group Russell group High Levels of OC were observed in the FT during ACE-Asia by 2 independent measurement techniques. We cannot simulate this OC with direct emissions
Mean Observations Mean Simulation (GEOS-Chem) DO WE UNDERSTAND OTHER AEROSOLS? Secondary production Scavenging Scavenging GEOS-Chem simulates both the magnitude and shape of sulfate and EC concentrations throughout the troposphere what is different about OC?
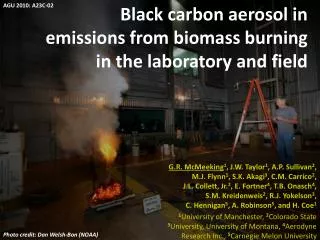
ANY INDICATION THAT DIRECT EMISSIONS ARE UNDERESTIMATED? • Biomass Burning: • Satellite firecounts show no active fires in Siberia • OC aerosol from agricultural burning in SE Asia emitted earlier in the season, at lower latitudes and is not injected into the FT • Pollution: • Although the highest aerosol observations are associated with elevated CO, there is a free tropospheric background of 1-3 μg sm-3 that is not correlated with CO or sulfate.
SECONDARY ORGANIC AEROSOL SIMULATION Secondary Organic Aerosol SOA parameterization [Chung and Seinfeld, 2002] VOCi + OXIDANTj ai,jP1i,j+ ai,jP2i,j Parameters (a’s K’s) from smog chamber studies Condensation of low vapour pressure ROGs on pre- existing aerosol Gi,j Pi,j Equilibrium (Komi,j) also f(POA) Reactive Organic Gases Ai,j Oxidation by OH, O3, NO3 GEOS-CHEM April Biogenic SOA Biogenic VOCs (eg. monoterpenes) FT observations ~ 4mg/m3 Biogenic SOA far too small!
Observed Simulated Asian air masses Sulfate: 0.24 µgm-3 OC: 0.53 µgm-3 Twice as much OC aerosol as sulfate observed at Crater Lake [Jaffe et al., 2005] High concentrations of OC aerosols measured in the FT over Asia (not captured by models) [Heald et al., 2005] IMPLICATIONS FOR TRANSPACIFIC TRANSPORT ASIA NORTH AMERICA PACIFIC
CARBON CYCLE AND POTENTIAL RADIATIVE IMPLICATIONS 4 ug/sm3 (ACE-Asia) AOD @ 50% RH: 0.057 TOA Radiative Forcing = -1.2 W/m2 OC AEROSOL 1 µg/sm3 from 2-7 km globally = 105 TgC/yr DISSOLVED ORGANIC CARBON IN RAINWATER 430 TgC/yr [Wiley et al., 2000] VOC EMISSIONS 500-1000 TgC/yr [IPCC, 2001]
ICARTT: COORDINATED ATMOSPHERIC CHEMISTRY CAMPAIGN OVER EASTERN NORTH AMERICA AND NORTH ATLANTIC IN SUMMER 2004 • 2004 fire season in North America: • worst fire season on record in Alaska Multi-agency, International Collaboration MOPITT Observations of CO Transport (July 17-19) [Turquety et al., in prep] Emissions derived from MODIS hot spots [Turquety et al., in prep] OC: 1.4 TgC OC emissions from biomass burning were 4 times climatological average!
UNDERESTIMATE OF OC AEROSOL DURING ICARTT WS=water soluble (10-80% of total OC, primarily SOA) Observed WSOC GEOS-Chem WSOC GEOS-Chem SOA NOAA ITCT-2K4 flight tracks (R. Weber’s PILS instrument aboard) OC aerosol underestimate observed over North America as well [Heald et al., in prep]. Note: biomass burning plumes were removed
BIOMASS BURNING & INJECTION HEIGHTS Fires over boreal regions generate enough energy to inject emissions into FT. Following Turquety et al. [in prep], we inject 60% of emissions directly into FT (3-5km) thus avoiding scavenging during lifting. ITCT-2K4 BB plumes ITCT-2K4 “Background” Observations GEOS-Chem Simulation solid=60% injected dashed=BL emissions dotted=no BB Large contribution of WSOC from boreal fires in plumes and background. Injection of BB emissions into the FT increases the OC observed in the FT down-wind. Model may underestimate boreal fires, or overestimate scavenging or dilution.
UNDERESTIMATE AT SURFACE SITES AS WELL… (IMPROVE network established in 1987 to monitor visibility in national parks) IMPROVE GEOS-Chem Sulfate OC Uniform ~0.9 μgCm-3 underestimate in OC across the U.S. Smaller contribution from Alaskan boreal fires at the surface than aloft.
INCLUDING ISOPRENE AS A SOURCE OF SOA Recent study: yield of SOA from isoprene is 0.9-3.0%[Kroll et al., 2005]. Isoprene oxidation products have been observed in the particulate phase [Claeys et al., 2004; Matsunaga et al., 2005] GEIA Emissions July/August 2004 10% yield = 0.8 Tg SOA 3% yield = 0.4 Tg SOA Isoprene is the second most abundant hydrocarbon emitted to the atmosphere (~500 Tg/yr). Even with a modest yield this could be an important source of SOA.
INCLUDING ISOPRENE AS A SOURCE OF SOA: COMPARISON WITH ITCT-2K4 OBSERVATIONS Observed WSOC Simulated WSOC solid =SOA terpenes only dotted = SOA terpenes+isoprene Simulated SOA solid =SOA terpenes only dotted = SOA terpenes+isoprene Including isoprene as a precursor to SOA formation (using low NOx yields) leads to modest increase in SOA simulated over the northeastern NA.
SHARED CHEMICAL ORIGINS OF WSOC? Correlation Coefficient Matrix Note: BB plumes removed No single species can explain more than 16% of the variability in WSOC. Toluene in combination with other tracers can explain over half the variability. Anthropogenic SOA?
IS SCAVENGING OF OC AEROSOLS OVERESTIMATED IN MODELS? Hydrophillic aerosols are wet scavenged assuming 100% solubility. Recent analysis of cloud events at Puy de Dome suggest scavenging efficiency of OC is much lower [Sellegri et al., 2003]. However aerosols observed at Jungfraujoch are internally mixed [Baltensperger] ITCT 2K4 Observations GEOS-Chem Simulation dashed: scavenging e=0.14 dottted: HSOG=103-107 M/atm A large decrease in scavenging efficiency increases OC throughout the troposphere, however this assumes a large degree of external mixing.
MEXICO CITY SURFACE OC Surface measurements of OC also underestimated at an urban polluted location. [Volkamer et al., 2006] OTHER STUDIES SUGGESTING UNDERESTIMATE OF SOA ANTHROPOGENIC ORGANIC CARBON BUDGET Growth in POM larger than decrease In aromatics “The increase in sub-µm POM could not be explained by the removal of aromatic precursors alone, suggesting that other species must have contributed and/or that the mechanism for POM formation is more efficient than previously assumed.” [de Gouw et al., 2005]
SMOG CHAMBER STUDIES: AMBIENT RELEVANCE NITROGEN OXIDE LEVELS TEMPERATURE Cold Temperature Chemistry: m-xylene photoxidation decomposition RO* (alkoxy radicals) aerosol formation? Add O2 [Johnson et al., 2005] [Song et al., 2005] m-xylene photoxidation Terpene ozonolysis 283K SOA yield at 283K ~2x yield at 303K 303K SOA yields zero at VOC/NOx = 4.5 [Presto et al., 2005] [Takekawa et al., 2005]
FORMATION MECHANISMS FOR ADDITIONAL SOA OLIGOMERIZATION CLOUD PROCESSING 2.5 hrs Evaporation Oxidation by OH VOC TMB Mechanism for cloud-processing of isoprene has been demonstrated in the lab. 4.5 hrs Growth of higher mass [Lim et al., 2005] UPTAKE OF GLYOXAL ON AEROSOLS 6.5 hrs Polymerization (oligomerization) produces higher mass compounds with lower vapour pressure SOA Uptake of glyoxal can increase SOA by at least 15% [Kalberer et al., 2004] [Volkamer et al., 2006]
CONSTRAINTS FROM SATELLITES?AEROSOL OPTICAL DEPTHS 2001/2005 MODIS MISR CAM Community Atmospheric Model (NCAR ESM with MOZART chemistry) Simulated AOD overestimated over land and underestimated over oceans. Retrieval uncertainties larger than SOA signal. MODIS/ MISR Aerosols Land (difficult to characterize reflectance)
CONSTRAINTS FROM SATELLITES?GLYOXAL: AROMATIC OXIDATION PRODUCT • Space-based observations can test: • Evidence of glyoxal uptake on aerosols? • General test on VOC chemistry Courtesy: Rainer Volkamer
BEFORE: ORGANIC CARBON AEROSOL *Numbers from IPCC [2001] Secondary Organic Aerosol (SOA): 8-40 TgC/yr Reactive Organic Gases OC Nucleation or Condensation Oxidation by OH, O3, NO3 FF: 45-80 TgC/yr BB: 10-30 TgC/yr Monoterpenes Aromatics Direct Emission Fossil Fuel Biomass Burning BIOGENIC SOURCES ANTHROPOGENIC SOURCES
ORGANIC CARBON AEROSOL Cloud Processing SOA: ?? TgC/yr OC Nucleation or Condensation ROG Heterogeneous Reactions Oxidation by OH, O3, NO3 FF: 45-80 TgC/yr BB: 10-30 TgC/yr Monoterpenes Isoprene Aromatics Direct Emission Fossil Fuel Biomass Burning BIOGENIC SOURCES ANTHROPOGENIC SOURCES
CONCLUSIONS • Concentrations observed in the FT off of Asia during ACE-Asia were 1-2 orders of magnitude greater than simulated. • Cannot be reconciled with uncertainties in current models • Important implications for transpacific transport • Concentrations of WSOC observed over NE North America during ITCT-2K4 were underestimated by a factor of 2 • Much larger biomass burning influence • No clear indication from the observations on the source of background OC in the free troposphere anthropogenic SOA? • Uncertainties in sources and sinks can resolve the disagreement • Processes leading to SOA formation not clearly understood and not captured with current model parameterizations. Expect that estimates of the global source of SOA will be revised upwards. FUNDING ACKNOWLEDGEMENTS: EPA, EPRI, NASA ESS Fellowship, NOAA Global & Climate Change Postdoctoral Fellowship