Download
1 / 14
140 likes | 156 Views
Enhancing modeling of organic aerosol during the MEGAPOLI summer campaign in Paris region. Objective to quantify primary and secondary sources of organic aerosols using Volatility Basis Set approach for a more accurate simulation.

E N D
Modeling of Organic Aerosol during the MEGAPOLI Summer Campaign in the Paris Region CHIMERE - Volatility Basis Set approach Q.J.Zhang (1)*, M.Beekmann (1), L. Poulain (2), A. Held (2), A. Wiedensohler (2), H. Herrmann (2), K. Kamilli (2), P. de Carlo (3), M. Crippa (3), R. Chirico (3), M. Heringa (3), Claudia Mohr (3), A. Prevot (3), U. Baltensperger (3), E. Freney (4), A. Schwarzenboeck (4), K. Sellegri (4), J.M. Pichon (4), L. Gomes (5), B. Bessagnet (6), S. Pandis (7), A. Hodzic(8) zhang@lisa.univ-paris12.fr (1) Laboratoire Interuniversitaire des Systèmes Atmosphériques (LISA), Université Paris Est et 7, CNRS, Créteil, France (2) Institute for Troposphärenforschung, Leipzig, Germany, (3) Paul Scherrer Institut, Villingen, Switzerland, (4) Laboratoire de Météorologie Physique, Clermont-Ferrand, France (5) Centre National de Recherche Météorologique, Toulouse, France (6) Institut National de l'EnviRonnement industriel et des rISques, Verneuil en Halatte, France (7) Foundation for Research and Technology, Hellas, University of Patras, Greece (8) National Center for Atmospheric Research, USA. * Also Aria technologies 2010/05/03 EGU, Vienna
Volkamer et al., GRL, 2006 Objective:Improve simulation of SOA in CHIMERE (regional CTM) Context & Objective • SOA (Secondary Organic Aerosol): under-estimated in Chemistry Transport Models • Comparison Model / Measurement, 05/2007-06/2007 LHVP , (urban MEGAPOLI site) Observed SOA (J. Sciare, LSCE) Simulated SOA (classic) Simulated anthropogenic SOA (classic) MEGAPOLI Paris Campaign: Quantify primary and secondary sources of organic aerosols, in urban and in plume Volatility Basis Set approach (VBS) ) Robinson et al., 2007 Laneet al. 2008 Compare with MEGAPOLI measurements
Phase transfer Aerosol • VBS « Volatility Basis-Set » approach OH VOC precursors n ∑SVOC with defined volatility bins (Robinson et al., 2007, Lane et al. 2008, Murphy and Pandis. 2009) SOA scheme in CHIMERE • Classic scheme in CHIMERE α∑SVOC (Surrogated Semi-volatile VOC species with distinct volatilities) OH, O3, NO3 VOC precursors (Pun et Seigneur,2006, Bessagnet et al. 2008)
C* (µg m-3) at 298K Saturation concentration ∆Hv (kJ mol-1) VBS approach main features Classic POA emission partitioning of POA (SVOC) emissions additional IVOC emissions Normalized emission factor with respect to classic POA emission Chemical aging Robinson et al., 2007, Murphy et Pandis. 2009 Semivolatile-SOA (S-SOA)
Gocart/LMDz Model configuration GFS/MM5 Meteorology domain Resolution CONT 0.5°× 0.5° GN9 9km ×9km CHIMERE Gas phase mechanism, 50 species,120 reactions MELCHIOR2 Inorganic mechanism (Nenes et al., 1998) ISORROPIA Two-product method / VBS approach SOA Scheme EMEP Anthropogenic MEGAN Biogenic Emissions
Partitioning of POA emissions (SVOC) + additional IVOC Lumped VOC according to SAPRC 4 volatility bins Biogenic SOA (BSOA) VBS VBS Classic Semivolatile-SOA Anthropogenic SOA Chemical aging Chemical aging • Simulations with classic scheme (POA non-volatile) • Simulations with VBS Total SOA=Oxygenated OA (Laneet al. 2008) (Pun and Seigneur, 2006; Bessagnet al. 2008) (Robinson et al., 2007, Murphy and Pandis. 2009)
Paris OA –LaMP (µg/m3) AMS measurements Aerodyne aerosol Mass spectrometer (AMS) Organic Aerosol (OA) LHVP: by IFT (urban site) Preliminary simplified PMF (Positive Matrix) Factorization (Poor man’s PMF) Hydrocarbon-like Organic Aerosol (HOA) Biomass Burning Organic Aerosol (BBOA) HOA+BBOA Primary Organic Aerosol (POA) Oxygenated Organic Aerosol (OOA) OOA S-SOA+ASOA+BSOA SIRTA: upwind of Paris agglomeration, by PSI (suburban site) Flight: by LaMP
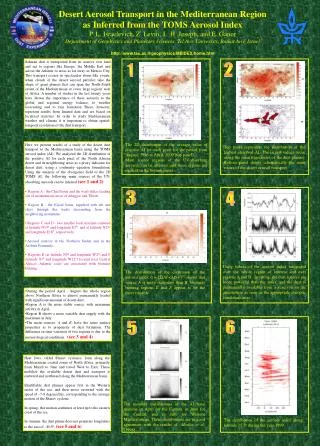
Paris HOA Model-VBS POA Model-Classic OOA AMS Poor man’s PMF HOA/BBOA AMS Poor man’s PMF SOA Model -Classic OOA Model -VBS Simulation results (LHVP-Urban site) vs. ground based AMS measurements µg/m3 In VBS, POA SVOC+IVOC gas phase reduce POA (aerosol) µg/m3 Continental Local
POA+BSOA S-SOA+BSOA OA (LHVP-Urban site) Continental Classic over-estimate peaks, close at background concentration µg/m3 VBS close at peaks, underestimate background concentration µg/m3 S-SOA_VBS
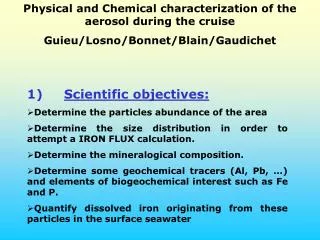
Paris OA Model -Classic OA Model -VBS OA AMS Simulation results (SIRTA-Suburban site) vs. ground based AMS measurements 20 µg/m3 16 Upwind underestimated 12 8 4 0 July 14 July 15 July 16 July 17 July 02 July 03 July 06 July 07 July 08 July 12 July 13 July 18 July 20 July 21 July 01 July 04 July 05 July 09 July 10 July 11 July 19 July 22 Downwind µg/m3 S-SOA_VBS Mostly BSOA Continental
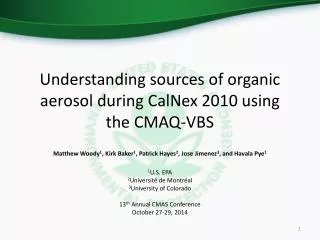
Regional influence on OOA plume Anthropogenic Biogenic Local
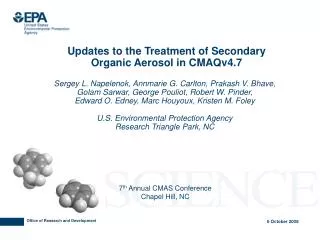
µg/m3 Measurement OA Background concentration ppb Ox=O3+NO2 Local formation of OA vs. measurements on flight Flight 32 20090721 Measurement µg/m3 100KM Model VBS µg/m3 Model-VBS
Conclusion • The “Volatility Basis Set” VBS approach has been implemented into a regional CTM (CHIMERE) and evaluated with measurements from the MEGAPOLI Paris summer campaign • Urban / suburban sites • The VBS approach avoids an overestimation of urban HOA • OOA peaks with strong continental influx, and a local peak with strong simulated anthropogenic aerosol are better simulated by VBS • => important contribution from S-SOA vs. ASOA • Underestimation of OOA peaks with simulated BSOA origin, • underestimation of background concentrations. • Plume evolution (for one flight with strong OA formation in plume): • VBS under-estimates background OA levels; • slope of OA / Ox plot is OK within a factor of two • OUTLOOK : • Sensitivity tests under way (yields, chemical aging speed, POA emissions and volatility) • Redo evaluation with full data set , including winter campaign
Acknowledgement The research leading to these results has received funding from the European Community's Seventh Framework Programme FP/2007-2011 MEGAPOLI under grant agreement n°212520. The MEGAPOLI campaign has received additional support by French ANR and LEFE/CHAT programs, and by the Ile de France SEPPE program. IFT, PSI and LaMP teams are thanked for providing AMS measurement data.