Download
1 / 21
210 likes | 389 Views
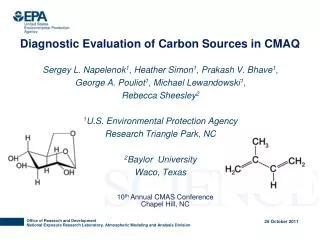
Understanding sources of organic aerosol during CalNex 2010 using the CMAQ-VBS. Matthew Woody 1 , Kirk Baker 1 , Patrick Hayes 2 , Jose Jimenez 3 , and Havala Pye 1 1 U.S. EPA 2 Université de Montréal 3 University of Colorado 13 th Annual CMAS Conference October 27-29, 2014.

E N D
Understanding sources of organic aerosol during CalNex 2010 using the CMAQ-VBS Matthew Woody1, Kirk Baker1, Patrick Hayes2, Jose Jimenez3, and HavalaPye1 1U.S. EPA 2Université de Montréal 3University of Colorado 13th Annual CMAS Conference October 27-29, 2014
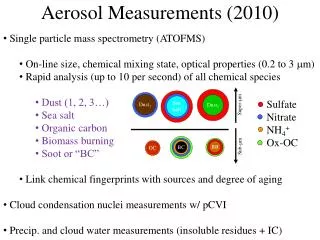
Motivation • 41% of the measured submicron aerosol mass at Pasadena was organic during CalNex • > 70% of midday OA is estimated to be secondary in Pasadena, CA (Hayes et al., JGR, 2013) • CMAQ traditionally underpredicts SOA (Foley et al., GMD, 2010; de Gouwet al., JGR, 2008; Volkamer et al., GRL, 2006) • OA measurements collected during CalNex (AMS, 14C) provide unique opportunity to evaluate CMAQ with the volatility basis set (CMAQ-VBS) (Koo et al., AE, 2014)
CMAQ-VBS • Organic aerosols lumped based on volatility • 4 basis sets in CMAQ-VBS • Primary anthropogenic and biogenic [biomass burning (BBOA)]; secondary anthropogenic and biogenic • 5 bins for each basis set (C* values of 100 to 103µg m-3plus 1 non-volatile bin) • Primary organic aerosols (POA) treated as semi-volatile (SVOCs) and aged • Anthropogenic secondary organic aerosols (SOA) aged • Includes SOA formation pathway from intermediate volatility organic compounds (IVOCs) • IVOC emissions = 1.5 x SVOC emissions
Schematic of CMAQ-VBS OA Module Oxidation IVOCs Oxidation Aromatics SV_ASOA1 SV_ASOA2 SV_ASOA3 SV_ASOA4 POA0 POA1 POA2 POA3 POA4 SV_POA1 SV_POA2 SV_POA3 SV_POA4 Alkanes ASOA0 ASOA1 ASOA2 ASOA3 ASOA4 Aging Aging Aging BBOA0 BBOA1 BBOA2 BBOA3 BBOA4 SV_BSOA1 SV_BSOA2 SV_BSOA3 SV_BSOA4 BSOA0 BSOA1 BSOA2 BSOA3 BSOA4 VOC Emissions Oxidation SV_BBOA1 SV_BBOA2 SV_BBOA3 SV_BBOA4 Isoprene Terpenes Biomass Burning POA Emissions POA Emissions VOC Emissions
Model Setup • CMAQ v5.0.2 • CB05 • AERO6 + VBS • 4 km grid resolution • May and June, 2010 • 2011 NEI v1 • POA + SVOC emissions = NEI POA (no scaling), IVOC = 1.5 x POA • Added basis set for meat cooking + ability to track POA from gas, diesel, meat cooking, and “other” sources separately Bakersfield Pasadena
CMAQ-AE6 and CMAQ-VBS OC Model Performance CMAQ-AE6 OC performance better at CSN and IMPROVE sites
Organic Matter (OM) Lower OM concentrations with CMAQ-VBS
POA (VBS POA + BBOA) CMAQ-VBS semi-volatile POA treatment lowers POA concentrations considerably
Biogenic SOA Biogenic SOA comparable between two OA schemes
Anthropogenic SOA CMAQ-VBS produces considerably more anthropogenic SOA (~10x)
Anthropogenic SOA x10 CMAQ-VBS produces considerably more anthropogenic SOA (~10x)
Comparison with AMS Measurements (Pasadena) CMAQ-AE6 CMAQ-VBS CMAQ-AE6 overpredicts POA (AMS HOA) and underpredicts SOA CMAQ-VBS better represents SOA diurnal profile [but peak still 4.6x lower than measured peak SOA (LV-OOA + SV-OOA)]
CMAQ-VBS SOA/ΔCO vs. Photochemical Age (log NOx/NOy) (Pasadena) CMAQ-VBS SOA/ΔCO vs. photochemical age (fairest comparison of model vs. observations) ~1.7x lower than observations (108 μg m-3 ppm-1); CMAQ-AE6 ~13.5x lower
CMAQ-VBS SOA Contributions (Pasadena) Daily Average Diurnal Profile Anthropogenic Aging Pasadena Anthropogenic Aging Biogenic Aging Biogenic Aging Anthropogenic Aging Bakersfield Biogenic Aging CMAQ-VBS SOA formed from VOCs (A_VOC and B_VOC) comparable to CMAQ-AE6. Most CMAQ-VBS SOA formed from aging [A_AGE and B_AGE (sensitivity test)]
CMAQ-VBS POA Source Apportionment Gas Diesel x 10 1.20 0.120 1.05 0.105 0.90 0.090 0.75 0.075 0.60 0.060 0.45 0.045 0.30 0.030 0.15 0.015 0.00 0.000 μg m-3 μg m-3 Other Meat Cooking 1.20 1.20 1.05 1.05 0.90 0.90 0.75 0.75 0.60 0.60 0.45 0.45 0.30 0.30 0.15 0.15 0.00 0.00 μg m-3 μg m-3 Majority of POA in LA attributed to meat cooking (at Pasadena: ~55% meat cooking, 21% gas, 15% other, and 9% diesel)
Non-Fossil vs. Fossil Carbon Non-Fossil Fossil Pasadena Bakersfield CMAQ-VBS overpredicts (underpredicts) fossil (non-fossil) fraction (obs ~50/50 split); however likely positive bias in non-fossil measurements
Non-Fossil Fraction (Pasadena) Obs. CMAQ-VBS CMAQ-VBS captures diurnal profile of non-fossil fraction well but biased low Non-Fossil Fraction (OC) Non-Fossil Fraction (TC) (Zotter et al., JGR, 2014)
Conclusions • CMAQ-AE6 OC performance better at routine networks (CSN, IMPROVE) • CMAQ-VBS underpredicts OC due to semi-volatile treatment of POA • CMAQ-VBS better represents SOA/POA split at Pasadena • CMAQ-VBS semi-volatile POA compares favorably to AMS HOA • Majority of SOA mass formed from aging • SOA still underpredicted (~4.6x compared to AMS peak) • VOCs generally well represented (Baker et al., ACP, in prep.) • Photochemical age ~1.7x too low • Yields ~2.7x too low, within 4x uncertainty reported by Zhang et al. (PNAS, 2014) • Majority of POA at Pasadena attributed to meat cooking • CMAQ-VBS overpredictsfossil C and underpredicts non-fossil C
Acknowledgements John Offenberg, U.S. EPA This project was supported in part by an appointment to the Internship/Research Participation Program at the Office of Research and Development, U.S. Environmental Protection Agency, administered by the Oak Ridge Institute for Science and Education through an interagency agreement between the U.S. Department of Energy and EPA.
CMAQ-VBS Volatility Distribution Wider range of volatilities represented in CMAQ-VBS. Majority of CMAQ-AE6 OA mass (not shown) in 2-3 bins (NV, 101, 102) (Baker et al., ACP, in prep.)