Download
1 / 5
50 likes | 156 Views
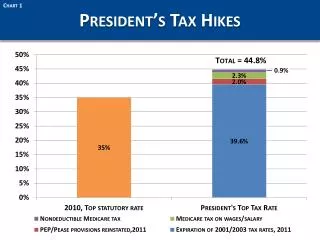
Explore the impact of tax hikes, tax relief, and tax code progressivity on income levels. Analyze correlations between tax revenues, rates, and GDP, examining the historical context and implications for fiscal policy decisions.

E N D
Chart 1 President’s Tax Hikes
Chart 2 Tax Relief Made Tax Code More ProgressiveBreakdown of Tax Burden by Income Level – 2001 vs 2008
Chart 3 Tax Revenues Do Not Correlate Well with Tax Rates 100% 90% 80% Top Income Tax Bracket 70% 60% 50% 40% 30% Total Tax Revenue as Percent of GDP 20% Income Tax Revenue as Percent of GDP 10% 1950 1955 1960 1965 1970 1975 1980 1985 1990 1995 2000 2005 Fiscal Year
Chart 4 Tax Revenues are Highly Correlated With GDP Real 2006 GDP ($Billions) Real 2006 Tax Revenues ($Billions) $14,000 Real Tax Revenue $2,500 $2,000 $10,500 Real GDP $1,500 $7,000 $1,000 $3,500 $500 1950 1960 1970 1980 1990 2000
Chart 5 Chasing Higher Spending with Taxes(Increase in Tax Rates Necessary to Keep Pace Spending)