Download
1 / 38
490 likes | 835 Views
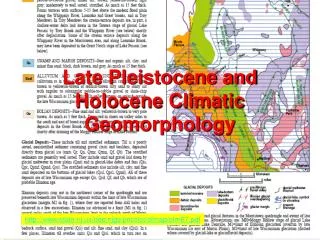
Late Pleistocene and Holocene Climatic Geomorphology. http://www.state.nj.us/dep/njgs/pricelst/ofmap/ofm67.pdf. Past 150,000 years Most Modern Surfaces. A Useful Glossary. Wisconsinan Glacial 20,000 ya. Sea level Drops during Glacial Stages Continental Glaciers form on land.

E N D
Late Pleistocene and Holocene Climatic Geomorphology http://www.state.nj.us/dep/njgs/pricelst/ofmap/ofm67.pdf
Past 150,000 years Most Modern Surfaces A Useful Glossary
Wisconsinan Glacial 20,000 ya Sea level Drops during Glacial Stages Continental Glaciers form on land Maximum glaciation occurs at coincidence of astronomical cycles if land in polar latitudes
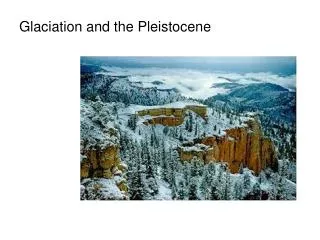
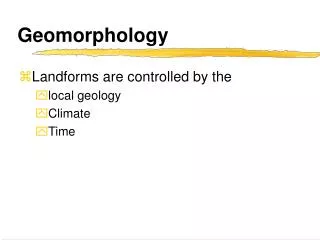
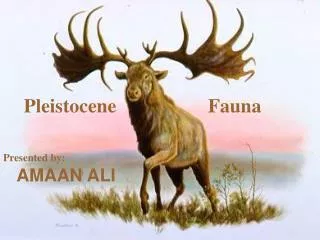
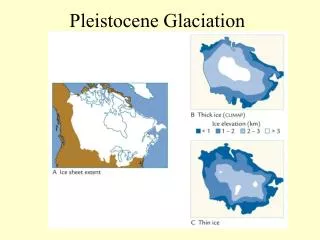
Pleistocene Glaciation • The Pleistocene began about 1.8 – 1.6 mya and ended about 10,000 years ago • several intervals of widespread glaciation took place, separated by warmer intervals
Pleistocene Stages C-14 works here LATE Q Glacial advances named for states most affected
Holocene Stages warmest
Oxygen in Greenland and Vostok glacial ice and trapped air bubbles reveals the stable isotopes of Pleistocene to Recent snow. Uppermost warm in picture is the current interglacial, the Holocene
The Late Tertiary and Quaternary oxygen isotope record measured in marine fossil shells Evap. water and CO2 during glacial time removes 16O to glacier ice leaving 18O in oceans for CaCO3 shell cf Figure 4.7 of Bloom
Global Temperatures Cycle, largest about 100,000 Year (orbit eccentricity) Smaller signals about 25K and 41K Wisconsinan Illinoian Interglacials get really WARM and vary in duration
Lowered Sea-level exposed continental shelf Long Island and Cape Cod Moraines
Cosmic rays bombard atmospheric atoms Atoms split into smaller particles, among them neutrons Carbon-14 Neutrons strike nitrogen atoms Nitrogen atoms lose a proton and becomes carbon-14 C-14 mixes with atmospheric oxygen to produce CO2 C-14 absorbed by living organisms CO2 taken up by plants CO2 dissolved in water C-14 intake ceases when organism dies; C-14 concentration decreases as the radioactive isotope decays
Tree Rings Years of age 500 Annual-ring similarities show correlation 400 Current year 200 150 100 50 Start with cores from living trees, overlap with buried or submerged fossil logs from the same region Tree growth rings A D C B A B Sediment layers with tree logs to be collected for dendrochronology C D Buried tree logs
Lakes south of the glacier track its advance - NH Dating with Lake Varves Very little or no runoff Heavy runoff into lake Ice Winter Summer Clear water Turbid water Winter layer (fine, thin, and dark-colored) Summer layer (coarse, thick, and light-colored) Modern Lakes, just count back from present. Fossil pollen track climate.
Hanneke Bos homepage Hanneke Bos Research
Northern Europe Iron age Bronze age Neolithic Mesolithic Paleolithic http://en.wikipedia.org/wiki/Pollen_zone
For the rest of the lecture • The rest of Chapter 18 does a nice job of summarizing selected late Quaternary landforms around the world, and repeating topics we have already covered (e.g. pluvial lakes) • For the rest of this lecture, however, let's take a look at New Jersey • http://www.state.nj.us/dep/njgs/pricelst/njgsmaps.htmprovides downloadable surficial maps, good for finding glacial features
Sea Level Changes • Between glacial periods, sea level rose as ice sheets melted. • Shoreline and estuarine deposits were laid down as the Cape May Formation. • Most prominent terrace deposited 125,000 years ago, when sea level was 20 feet higher. Slide modified from Scott Sandford
Most of the rest of the lecture will use slides from Kroll (2009) Geology of New Jersey, sometimes from NJGS sources. Used with permission. Plainfield Slide modified from Kroll 2009
The Eastern lobe of the Wisconsinan Glacier made and end run around the Watchungs and extended down to the vicinity of our campus Slide modified from Kroll 2009
These Moraines and the Watchungs trapped meltwater as the glaciers retreated’ forming proglacial lakes Slide modified from Kroll 2009 Basking Ridge Moraine Great Swamp
Slide modified from Kroll 2009 The lake breached the dams at, for example, Millington Gorge BaskingRidge Millington Gorge
After the raising of the lake's level, the lake cut outlet gorges at Millington and Moggy Hollow near Far Hills. As the glacier retreated further a lower more northerly exit was exposed around the north end of the Watchung range, forming the gorge of the Great Falls of the Passaic River in Paterson. http://en.wikipedia.org/wiki/Great_Falls_of_the_Passaic_River
Various sedimentary deposits show the extent of the lake Slide modified from Kroll 2009
Minimum Ice Thickness 1400 ' Slide modified from Kroll 2009 High Point, NJ
Roche Moutonée Hamburg Slide modified from Kroll 2009
North-South Glacial Striations on the Roche Moutonée Slide modified from Kroll 2009
Note rounding and till beneath. Possibly carried further in outwash Slide from Kroll 2009
Drumlin near Oak Ridge, NJ Slide by Prof. Smart Slide by Prof. Smart
Esker (ic) near Wantage http://www.state.nj.us/dep/njgs/pricelst/gmseries/gms85-1.pdf Slide by Prof. Smart
Kettles, Convent Station Slide by Prof. Smart
Chaotic deposits caused by yearly melting and refreezing of surface Bridgeton Formation sediments, near Hammonton, New Jersey, evidence of Periglacial conditions.