Download
1 / 7
80 likes | 402 Views
Explore the concept of normal distribution and bell curves through real-life scenarios, showing how data varies around mean values. Learn to interpret percentages within standard deviations to make informed decisions.

E N D
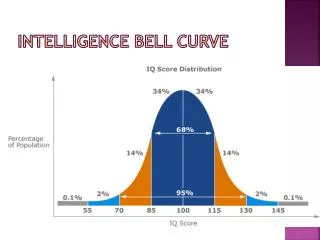
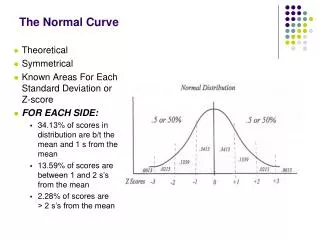
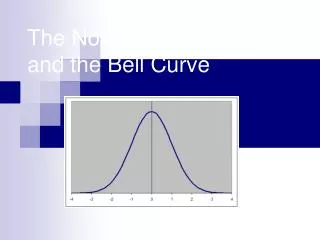
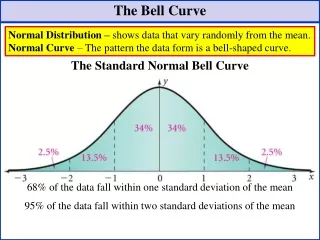
The Bell Curve Normal Distribution – shows data that vary randomly from the mean. Normal Curve – The pattern the data form is a bell-shaped curve. The Standard Normal Bell Curve 68% of the data fall within one standard deviation of the mean 95% of the data fall within two standard deviations of the mean
Using the Standard Normal Curve Ex 1) A survey of the employees of XYZ Corporation found that the mean of the morning commute times to work was 18 minutes. The standard deviation was 4 minutes. Sketch a normal curve showing the commute times at one, two, and three standard deviations from the mean. • What values are one standard deviation from the mean? • What percent of the data can you expect to find between 18 and 22 minutes? • Of 124 commuters, how many could you expect to be driving between 22 and 25 minutes to work?
Using the Standard Normal Curve Ex 2) The jaw widths of a population of great white sharks are normally distributed abut a mean of 15.7 in. The standard deviation of the widths is 2.8 in. Sketch a normal curve showing the jaw widths at one, two, and three standard deviations from the mean.
Using the Standard Normal Curve Ex 3) In a survey of 240 people, the responses to the question, “How much time do you spend in the shower every day?” were normally distributed. The mean was 15 minutes; the standard deviation was 2 minutes. Sketch a normal curve showing the shower times within one, two, and three standard deviations of the mean. • What percentage of people’s shower time is within two standard deviations of the mean? • 2) How many people shower between 17 and 19 minutes? • 3) How many people shower less than 13 minutes and greater than 17 minutes?
Using the Standard Normal Curve Ex 4) In a university lecture class with 174 students, the final exam scores have a mean of 68.5 and a standard deviation of 7.3. The grades on the exams follow a normal curve • About how many students receive grades from one to two standard deviations above the mean? • 2) About how many students receive grades of 61 or below?
Using the Standard Normal Curve Ex 5) The number of paper clips in a truckload of boxes are normally distributed, with a mean of 100 and a standard deviation of 5. • What percentage of the boxes contain less than 95 paper clips? • 2) About how many boxes have between 100 and 110 paper clips?
12.7 Normal Distributions Homework #31 Pg 695 #5-13