Download
1 / 7
70 likes | 261 Views
Measurement and the Bell Curve. Sarah L. Kohn, Ed.S ., NCSP School Psychologist Denver Public Schools August 2012. Descriptive Statistics.

E N D
Measurement and the Bell Curve Sarah L. Kohn, Ed.S., NCSP School Psychologist Denver Public Schools August 2012
Descriptive Statistics • Measures of Central Tendency: When we need a statistic to represent the typical/average/middle score of a group of scores and define the center in slightly different ways • Mode: number/score occurring most frequently • Median: the middle score; separates the top half of the group from the bottom half of the group • Mean: sum of the set of scores, divided by the total number of scores • Percentile: score below which any other percentage of the group falls • Seldom do these numbers have the same value, but they often do not differ greatly, unless the set of scores is skewed
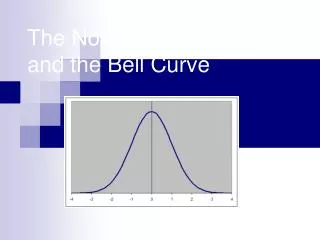
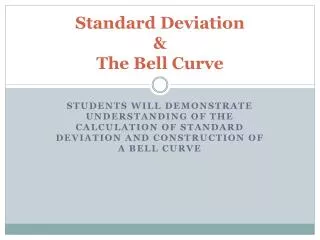
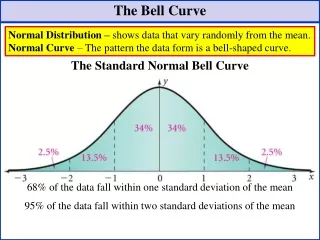
Inferential Statistics • Measures of Variability: how variable scores are – how much they spread out from high to low • Range: difference between the highest and the lowest scores • Quartiles: middle 50% of scores, between the 25th and 75th percentiles • Standard Deviation: how much variation or dispersion exists from the average/mean • Low SD: indicates that scores hover around the average/mean • High SD: indicates that scores are more spread out over a larger range of values • Normal distribution/normal curve/bell curve: most of the cases of any set of numbers pile up in the middle scores
Evaluating Students • Must compile a body of evidence, which includes… • Structured or semi-structured observations completed by one or Special Education team members, both in the subject/classroom of concern as well as in an easier setting for the student • Interviews with parent(s)/guardian(s), teacher(s) and student • Review of records (cumulative file, IC, previous IEPs, etc.) • Progress monitoring information • Formal, norm-referenced evaluations with the student (e.g. IQ tests, achievement tests, targeted evaluations) • Formal, norm-referenced evaluations without the student (behavioral rating scales/questionnaires distributed to individuals to complete and return)
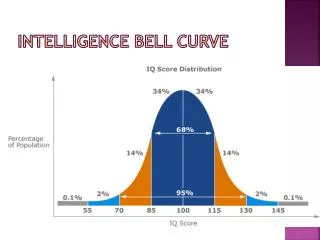
Evaluating Students • So, when formal, norm-referenced evaluations are completed, student’s scores must fall in a certain area of the bell curve • One SD is typically +/- 10 or 15 points from the average score • For some evaluations, the average score is 100 • Therefore, average performance is considered a score between 85 - 115 • For other evaluations, the average score is 50 • Here, the average performance falls between 40 – 60 • Each score is also statistically related to a percentile and you will find scores reported with either or both of the score and the percentile listed • Typically, students must fall at least 1.5 SDs above or below the mean/average to be considered out of the range of normal functioning • These results must also be demonstrated in conjunction with not making enough growth/or not being challenged enough based on CBM and other information discussed on previous slide
Evaluating Students • Thus, IDEIA (Individuals with Disabilities in Education Improvement Act) requires certain criteria for students to qualify to receive Special Education Services • Almost always involves students functioning below the 12th percentile or 2 SDs below the mean • It varies for the 12 different qualification categories • Specific Learning Disability (SLD) • Significant Limited Intellectual Capacity (SLIC) • Significant Identifiable Emotional Disability (SIED) • Autism • Traumatic Brain Injury (TBI) • Physical Disability (ADHD falls under this category) • Speech/Language Impairment (SLI) • Also, Preschooler with a Disability, Visual Impairment, Hearing Impairment, Deaf/Blind, Multiple Disabilities • ***ADD GT INFORMATION • Discuss disability information for each of major bullets above • Put this PP in front of those disability pages