Download
1 / 32
320 likes | 438 Views
The beginning of the end… How EDN 14 will contribute to the DSS. Connely Baldwin David Tarboton. Utah Water Research Laboratory Utah State University. Outline. Purpose Context DSS Worksheet Synopsis EDN 14 – Surface Water Quantity Model Development Tasks DSS details – the first iteration

E N D
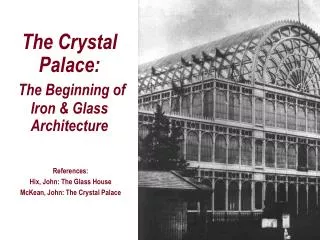
The beginning of the end…How EDN 14 will contribute to the DSS Connely Baldwin David Tarboton Utah Water Research Laboratory Utah State University
Outline • Purpose • Context • DSS Worksheet Synopsis • EDN 14 – Surface Water Quantity Model Development Tasks • DSS details – the first iteration • Discussion
Purpose for EDN14 • Clarify model-to-model and model-to-data interactions for the surface water quantity components of the Nooksack DSS • Clarify the form of outputs required from the surface water quantity components of the Nooksack DSS • Clarify the format for specification of decision alternatives to the surface water quantity modeling components
Context • This is a stakeholder driven process • DSS worksheets provided a structured communication of issues at stake in WRIA1 • The outcome DSS should be a modeling and data visualization system that presents information relevant to most important decision issues
DSS worksheet synopsis • The worksheets served to define: • Possible management alternatives • Indicator variables (for decision making) • Spatial scale • Temporal scale • Overall period of simulation
DSS Worksheet Synopsis Management Alternative Categories • Diversions • Land Use/Land Cover • Water Rights and Ecological Flows • Storage • External Influences • Others (conservation, institutional)
DSS Worksheet Synopsis – An intriguing quotation • Background Conditions: “Years of inattention to baseline information gathering and water resource issues, citizen complacency, citizen investments based upon lack of enforcement and the private wells exemption lasting forever”
·Lynden North - Includes Kamm Slough, Fishtrap and Bertrand Creek drainages. Lynden North has a substantial number of water right applications and potential unpermitted water rights, transboundary issues, stream flows that do not meet legally established flows, and nitrate concerns. ·Sumas watershed – Give analytical attention to both surface and groundwater quantity constraints for current and future uses. ·Fraser River – The Fraser River drainage area is open for additional withdrawals and as such represents a potential area to look for solutions. ·South Fork – The South Fork routinely experiences stream flows that do not meet legally established flows and initial examination indicates that this is not due to consumptive withdrawals. ·Lake Whatcom/Middle Fork – The City of Bellingham obtains water from Lake Whatcom and the Middle Fork drainages. The City water supply may be a possible source of water for other areas of the WRIA. Agriculture in general – respond to concerns about impact on instream flows/changing from surface water to ground water withdrawals (distance to stream) DSS Worksheet Synopsis- Specific issues
·Agricultural lowland areas – Water conservation and reuse. Water rights implications for conserved water. Also, areas with potential supplies of water that could be reused (i.e., municipal or industrial waster water treatment facilities) would be likely focus areas. ·General – Appropriateness of 1985 IRPP Instream Flow Settings (e.g., South Fork). ·… refined information for all drainages of the mainstem of the Nooksack (below the forks) and aggregated information above. ·Hydraulic Continuity – Extent to which ground water withdrawals impact surface water flows needs to be determined to appropriately understand the physical availability of water. ·One-molecule rule – need to develop an agreed-upon pragmatic standard that can be applied realistically in making water allocation decisions within WRIA 1. Middle Fork Diversion – Optimal management Over-allocated drainages – ASR/Storage/Conservation/Reuse DSS Worksheet Synopsis- Specific issues
DSS Worksheet Synopsis – Model Output Needs • Temporal and spatial variability of streamflow • Focus on low flow periods • Water rights fulfillment • Flow Duration curves by period • GW level • Baseflow contribution
EDN 14 : Preliminary Surface Water Quantity Model Development • An iterative and collaborative process with involvement by YOU in a team environment • Tasks • Design of model-to-model and model-to-data interactions • Implementation of DSS design using placeholder models.
Task 1Model-to-model and model-to-data interactions Phase II and the DSS worksheets have provided documentation of the issues that need to be addressed by the DSS and the data available. It has also reviewed available modeling methodologies. The next step in developing the DSS is to define the model components, inputs, outputs and interactions. This demands definition of standardized interactions between models, e.g., how the surface water quantity model is linked to models from other related components. The inputs to and outputs from each model component need to be specified precisely in terms of location, scale and resolution. Deliverable An information flow diagram and accompanying text specifying the functionality of each model component.
Task 2Strawman implementation using placeholder models Some key issues in DSS development are best accomplished by building a working strawman DSS. These include graphical user interface design, database functionality, and presentation of the output. This task will build on the database design and visualization that is already part of the Water Quality data viewer. These interface items are nearly equal in importance to the development of rigorous underlying models. However, if these issues are only fully dealt with after the models are developed, there is significant risk of a less-than-optimal DSS. This can be avoided by implementing the design of Task 1 using “placeholder” models that provide the same output as the full model, but with extremely simplified methods. For example, the surface water quantity model would be a simple runoff coefficient model where runoff is defined as a constant fraction of rainfall. The same methods and input data would be used, but the model could be quickly implemented to define and test model-model interactions, and usability and format of model outputs. Deliverable A “strawman” surface water quantity DSS following the design of Task 1 comprising a suite of placeholder models to test the user interface and output functionality.
Data editing and importing tools Model component A (e.g. streamflow) Model component B (e.g. groundwater) DSS data, simulations and alternative specifications Data viewer Alternative builder Decision maker and analyst DSS – underlying structure
DSS – Detail on Components • Data Viewer (Similar to Water Quality Demo) • Produce high level watershed characterization summaries • View Historical Data • View Model Output (Fine Detail) • Alternative Builder • Change Diversions/Storage Options • Modify/Import Land Use Coverage
DSS – Visuals • Alternative Builder Examples • Data Viewer. What is the best way to compare the results of management alternatives and other conditions • High level watershed characterization summaries examples. • Detailed examination of historical and model output data.
DSS – Alternative Builder • Sequentially add various options graphically and enter detailed information: • Diversions • Land use changes • Storage • Save details as individual options • Mix and match to generate a management alternative
User clicks to add diversion location and fills in Yellow Highlighted Fields
Data ViewerWatershed Characterization Summaries • Summarize the results of the management alternatives and compare to other alternatives, pre-1850, or current conditions • Present output in readily understandable statements and plots • Distribute to stakeholders
Data ViewerDetail examiner • Ability to “drill down” and look at specific locations in detail. • Compare Management Alternatives at specific key locations. • Examine detailed model output, base flow, etc. • Variety of plotting options possible. • Primarily for technical users.
Location of Key Decision Points on Stream Network (outlet of drainages, streamflow gages, etc.)
Generate plots at key points to compare management alternatives
Summary Statistics Plot Options
Time Series Plot Possible Representation of Improvement of some Alternative over Current Conditions Blue – Time series of Mgmt Alternative Flow Yellow – Time series of Mgmt Alternative Base Flow Red – Time series of Current Conditions Drop Down Menu to Select Other Plot Types
Possible Customization of Box Plots Box Plot – Current Conditions Red Line – Mgmt. Alternative
Possible Representation of Improvement of some Alternative over Current Conditions (solid red) Fewer Instances of Low flow (hatched magenta) Direction of Change reinforced by arrow More Instances of Higher flow (hatched blue)
Discussion • We need your help • Does this meet your needs? • What information is most useful? • What information is unnecessary? • What have we left out that you want? • The next iteration