Download

1 / 76
790 likes | 1.25k Views
PQView® a Beginning in Smart Grid Implementation. Wieslaw Jerry Olechiw VP of International Sales Dranetz and Electrotek Concepts. Electrotek Office Locations. Edison, New Jersey. Knoxville, Tennessee. Beverly, Massachusetts. Dranetz-BMI. Power Monitoring Hardware Devices

E N D
PQView® a Beginning in Smart Grid Implementation. Wieslaw Jerry Olechiw VP of International Sales Dranetz and Electrotek Concepts.
Electrotek Office Locations Edison, New Jersey Knoxville, Tennessee Beverly, Massachusetts
Dranetz-BMI Power Monitoring Hardware Devices measure and monitor power Data Acquisition Devices measures physical processes Software andConsulting Services power quality engineering, consultations Daytronic Ownership Electrotek Concepts
GPT • Global Power Technology (GPT), Edison, NJ USA • Dranetz, Edison, New Jersey USA • 40 years of experience in Power Quality, Demand and Energy monitoring instrumentation and systems • Permanently installed and portable power quality, demand and energy solutions • Electrotek Concepts, Knoxville, Tennessee USA • Formed in 1984 • Power studies, consultations, utility system development, software development • Daytronic Corporation, Dayton, Ohio USA • Manufacturer of sensors and other data acquisition devices
Gossen Metrawatt • Gossen Metrawatt, Nuremburg, Germany • 100 year history • Manufacturer of test and measurement equipment including multi meters and other electrical testers • Camille Bauer, Wohlen, Switzerland • Manufacturer of data acquisition systems and sensors including energy monitoring systems
Who Uses PQView Today? • United States/Canada • American Electric Power • Alabama Power Company • Baltimore Gas and Electric • CMS Energy • CPS Energy San Antonio • Consolidated Edison Company of New York • Detroit Edison Company • Dominion Virginia Power • Duke Energy Corporation • East Kentucky Power Cooperative • EnerNex Corporation • Entergy Services • EPRI • Federal Aviation Administration • FirstEnergy • Georgia Power Company • Hawaiian Electric Company • Hydro One Networks • Hydro Ottawa • Knoxville Utilities Board • Maui Electric Company • Mississippi Power Company • NIST • Nebraska Public Power District • Northeast Utilities • Europe • Agder Energi Nett AS • BKK Nett AS • CEE Energiteknikk AS • Central Networks (E.ON) • Elektro Slovenia • Elektrobistand • Hålogaland Kraft AS • Helgelandskraft AS • Hydro Aluminium AS • Hrvatska Elektroprivreda (HEP) • Istad Nett AS • Lyse Nett AS • Nordmøre Energiverk AS • Notodden Energi AS • PSE-Operator • Rødøy-Lurøy Kraftverk AS • SFE Nett AS • Skagerak Nett AS • SINTEF • Statnett • StatoilHydro • Sunnfjord Energi AS • Sweco Grøner AS • Tafjord Kraftnett AS • Tussa Nett AS • Pepco Holdings, Inc. • Public Service Electric and Gas Company • Public Service of New Hampshire • Salt River Project • San Diego Gas and Electric • Southern California Edison • Southern Company • Tennessee Valley Authority • United Illuminating Company • Wisconsin Public Service • Wireless from AT&T • Asia-Pacific • Companhia de Electricidadede Macau (CEM) • Guangdong Power • Hebei EPRI • Henan EPRI • Northern China EPRI • Orion New Zealand Ltd. • Provincial Electricity Authority • Shanghai Municipal Electric Power Company • Shanghai Jiu Long Electric Power Science & Technology Company • Shanxi EPRI • Transpower New Zealand • Latin America • Central Hidroeléctrica de Caldas • Operador Nacional do Sistema Eléctrico
PQView and PQWeb Software System • PQView is a power quality database application • Key Functions • Automatic data management • E-mail alarming • Analysis of single events or long-term trends • Report writing • Fault locating • Load growth estimation • Reports available via workstations and web browsers • Growing user base from around the world in collaboration to improve the system each year
Smart Grid Challenges • Data Integration • Database Management • Automatic Characterization of Events • Automatic Reporting • Automatic Fault Identification • Proactive System Analysis
Smart Grid Challenges • Data Integration • Database Management • Automatic Characterization of Events • Automatic Reporting • Automatic Fault Identification • Proactive System Analysis
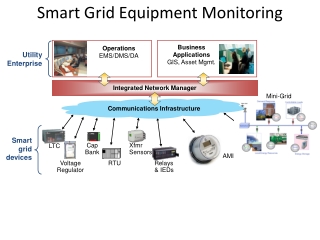
DataTranslator Permanent Power Quality Monitors Digital Fault Recorders & Relays Revenue Meters Report Event Data Protection Bench- Statistical Writing Viewer Trending Analysis Marking Analysis PQView Applications PQ View Software DataTranslator Data Characterizer SCADA, Relay and Breaker Data DataTranslator PQView Database DataTranslator OSIsoft PISystem Server Portable PQ Instruments Fault Location Process
PQView Data Source Summary • IEEE Std 1159.3-2003 PQDIF Files • More than 10 different major companies are in various stages of supporting PQDIF export. • IEEE C37.111-1991/1999 COMTRADE Files • Analog and digital samples from fault records and relays can be imported • MODBUS Devices • Arbiter® Systems Power Sentinel • CYME International CYMDIST • Dranetz-BMI InfoNode®, DataNode®, PQNode®, PQPager • Electro Industries/GaugeTech Communicator Log • Fluke® /RPM Power Recorders • Landis+Gyr® MAXsys® MAXtrac Databases and Text Files: Quad4 and Quad4 Plus • OSIsoft PI System Servers • Power Monitors (PMI®) Meters • Qualitrol® (LEM Instruments) Q-Wave Information System (QIS) Database • SATEC Instruments (PAS Databases) • Schneider Electric® (Power Measurement®, PML) ION® and ACM™ meters • Schweitzer Engineering Laboratories® (SEL) EVE Files • SoftSwitching Technologies® (SST) I-Grid® Web Site • Unipower PQ Secure • Text Files • PQView Text Files • Cooper Power Systems® V-Flicker Meter Data Files • Edison Electric Institute® (EEI) Load Data File Format • EDMI EziView: MK3 Revenue Meter Data Files • GridSense PowerView CSV • HIOKI® • Landis+Gyr® MAXsys® PRN Text Files • Siemens® SICARO PQ Manager Text Files
PQView Integration via IEEE PQDIF Files PQView PQ Data Manager PQDIF Translator Program Proprietary Data Filesor Database • PQDIF Files • PQDIF Folder • PQDIFPOF PQView Database
PQView Integrationvia IEEE COMTRADE Files PQView PQ Data Manager COMTRADE Translator Program Proprietary Data Filesor Database • COMTRADE Files • COMTRADE Folder PQView Database
Basic PQView Data Sources IEEE C37.111-1991/1999 COMTRADE Files • Confirmed compatibility files made by software for digital fault recorders and relays made by these vendors: • Beckwith Electric • E-MAX • Leading Edge Research (LER) • LEM Instruments (BEN Fault Recorder) • Mehta Tech • Schweitzer Engineering (SEL) • General Electric • SATEC • Square D Power Logic • Rochester • Can import both events (waveform and rms samples) and steady-state samples • Can be custom configured to support unapproved 1997 draft format
Second Option for PQView Integration withDranetz-BMI Signature System®/Encore Series Telephoneor Ethernet Connection InfoNode Server or DualNode PQView PQData Manager PQViewDatabase DataNodes
PQView Integrationwith Arbiter® Systems Power Sentinel 1133A Telephoneor Ethernet Connection InfoNode Server PQView PQData Manager EthernetConnections PQViewDatabase Power Sentinels
PQView Integrationwith General Electric kV Electricity Meter Telephoneor Ethernet Connection InfoNode Server PQView PQData Manager EthernetConnections PQViewDatabase GE kV Meters
PQView Integrationwith Dranetz-BMI Portable Monitors Power Xplorer PQView PQ Data Manager NodeLink Download or Compact Flash File Copy Power Guide DDB Files Power Visa PQViewDatabase Energy Platform EP-1
PQView Integration with Schneider ElectricDirect from Database Server Requires Optional ION Enterprise Data Handler for PQView Telephone or Ethernet Connections PQView PQ Data Manager with Optional ION Enterprise Data Handler ION Enterprise ION and ACMMeters PQView Database PEGASYS or ION EnterpriseDatabase ServerSybase, MSDE, Access, or SQL Server
PQView Integration with Landis+GyrMAXsys 2510 PRN Text Files Telephone Connections PQView PQData Manager DownloadServer Metersat Customers PRN TextFiles PQViewDatabase
PQView Integrationwith Landis+Gyr MAXtrac Database Telephone Connections DownloadServer Metersat Customers MAXtracDatabase PQViewDatabase
Integration of PQView and OSIsoft PI System PQView PQ Data Manager PiSlicer Library PI SDK PiSlicer PI Server PQViewDatabases PI Server PI Server Historian Database of SCADA Data
More PQView Data Sources Supported Customer-Specific Databases • Alabama Power Company • Custom Oracle Database of SCADA Operations • Ergon Energy • Custom Oracle Database of SWER Measurements • Salt River Project • Custom SQL Server databases with root cause analysis • Progress Energy • Custom Oracle database of feeder RTU measurements
More PQView Data Sources More Text File Formats • PQView Text File Formats • Data Logs • Waveform Event Samples • RMS Event Samples • EDMI EziView Text Files • HIOKI Hi-View Pro Text Files • Siemens® SICARO® Text Files • SWRI Leakage Current and Temperature Data Files
PQView Enterprise-Level Scalability • Monitoring Locations • Store measurements from thousands of meters • Measurements • Store up to two billion events and hundreds of billions of steady-state measurements in one database • File Size • Databases have a file size limit of one terabyte. • Speed • Querying events from databases with hundreds, thousands, or millions of power quality events take subseconds to seconds to run; the system does not bog down as the measurements database grows in size. • Simultaneous Users • When using PQWeb with measurements in a SQL Server database, the system will support 60+ concurrent users.
Ease of Use • Although PQView has many reports for quickly creating summary statistics from multi-gigabyte databases with billions of measurements, a user can quickly extract just as much meaningful information from databases as small as one megabyte.
Smart Grid Challenges • Data Integration • Database Management • Automatic Characterization of Events • Automatic Reporting • Automatic Fault Identification • Proactive System Analysis
DataTranslator Permanent Power Quality Monitors Digital Fault Recorders & Relays Revenue Meters Report Event Data Protection Bench- Statistical Writing Viewer Trending Analysis Marking Analysis PQView Applications PQ View Software DataTranslator Data Characterizer SCADA, Relay and Breaker Data DataTranslator PQView Database DataTranslator OSIsoft PISystem Server Portable PQ Instruments Fault Location Process
Database Management with PQView • Automatic Data Source Import • Measurements are imported either manually or automatically via a scheduler • Automatic Database Compaction and Repair • Automatic E-Mail Notification of New Power Quality Events and Data Source Problems
PQView’s Open Database Architecture • Measurements are stored in Microsoft® Access or Microsoft SQL Server™ format. • Advanced users can write their own queries, reports, web pages, and custom applications.
Export Capability to Other Applications • Measurements can be exported from a PQView database to many other formats, expanding its analysis capabilities: • Microsoft® Word Document (DOC) Files • Microsoft® Excel Spreadsheet (XLS) Files • IEEE PQDIF (PQD) Files • TOP, The Output Processor® • DranView® • World Wide Web (HTML and PNG) Files • Rich Text Format (RTF) Files • Comma Separated Variable (CSV) Files • Microsoft Snapshot (SNP) Files
Smart Grid Challenges • Data Integration • Database Management • Automatic Characterization of Events • Automatic Reporting • Automatic Fault Identification • Proactive System Analysis
Build Event Lists • Select the sites and date range you want to search for power quality events, then run the query!
Event List Features • Filter on Voltage Magnitude, Trigger Phase, and Event Type • Sort by meter name, event time stamp, event voltage magnitude, event type, or arbitrary meter text properties • Mark groups of measurements with a system event record. Specify cause, source, and description of system events • Mark events as invalid to be filtered from final analysis, or delete them from the database altogether
View Event Voltage, Current, and Power Waveform Samples • Waveform samples are displayed as part of an “event roll”
Event Roll Features • Scroll through events using the mouse wheel or the <PgUp> and <PgDn> keys • Zoom and Re-scale Charts using Mouse • Enable toggle buttons to automatically advance event roll through thousands of events at any speed you specify • View voltage and current on stacked axes or left-right axes • Mark check boxes to automatically perform computations • compute rms samples from waveform samples • compute line-line waveforms from line-neutral waveforms • compute power waveforms from voltage and current waveforms • Export Thousands of Events • IEEE PQDIF Files or CSV Text Files • TOP, Microsoft Excel, or Printer • Microsoft Word (DOC) Files • World Wide Web (HTML and PNG) Files
View RMS Voltage, Current, and Power Samples • Compute magnitude and duration for rms voltage variations according to IEC 61000-4-30
Create Trends and Histograms of Hundreds of Steady-State Logs The frequency measurements were recorded in Knoxville, Tennessee during Northeast Blackout of August 2003.
Trend and Histogram Features • Zoom and Rescale charts using Mouse • Export Charts to Microsoft Word Files • Specify high and low limits for trends to filter invalid measurements • Plot snapshot values, or the minimum, average, maximum values of intervals • Plot multiple channels on one chart, plot each channel on its own chart, or plot groups of related channels together
Create Aggregated Trends for Long-Term Logs This chart summarizes 48000 snapshot samples recorded over seven years.
Create Timelines to CombineEvent Data with Steady-State Logs Clicking or zooming on event tick marks will open an event roll