Download
1 / 16
160 likes | 300 Views
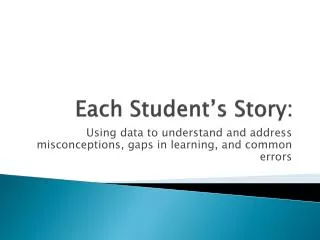
Each Student’s Story:. Using data to understand and address misconceptions, gaps in learning, and common errors. Essential Questions. How can schools transform EPAS data into classroom practice? How can teachers use EPAS data to target individual students while addressing group needs?

E N D
Each Student’s Story: Using data to understand and address misconceptions, gaps in learning, and common errors
Essential Questions • How can schools transform EPAS data into classroom practice? • How can teachers use EPAS data to target individual students while addressing group needs? • How can we use this process to model an instructional cycle that can be used for all formative assessment?
Our Characters • Dr. Monica Zucker, Assistant Principal, in charge of AP, TCAP, and other academic concerns • Ann Richards, English teacher who works 1 period a day on data analysis and professional development • English, math, and science teachers who teach 9th and 10th grade students
Our Setting • Grandview High School • In the Cherry Creek School District • 2,700 students • Suburban • Population • African American 9% • Asian 8% • Hispanic 14% • White 63% • Multi-racial 5%
The Plotline: Schoolwide data • We look at scores means and percent college ready first. • Although we note the composite score, we really focus on subject scores because teachers can affect change in their curricular area.
The Plotline: Student scores • As individual results come in, three copies are made—one for the English teacher, one for the math teacher, one for the science teacher. • These copies are sorted by secretaries in the building. • In a meeting, each teacher receives his or her students’ scores by class period.
Trend Examination Flow Map Discuss Grandview’s Overall Performance Examine Individual Questions Record Individual Data for Selected Students Formulate Instructional Plan Patterns Means College Ready Trends Wrong Answers Individuals Gaps Groups
Item Analysis • Folders • Part of the national package from ACT • Shows percent of students who chose each answer
Process of Understanding Each Student’s Story • Meet in department groups (English, Math, Science) • Pair up. Teachers look at overall data lists to determine the 5 - 10 students they want to understand. • Distribute the coded tests. • Log answers.
You Become an Active Character • Pair up • Follow protocol
What did you find? • Trends • National versus school • Groups • Individuals
Conflict • Internal Conflict • Teachers • Data surprises • Personalization • Responsibility for addressing gaps • External Conflict • Administrative support • Time • Funding • Participation
Contact Information • Ann Richards, English Teacher • arichards@cherrycreekschools.org • Dr. Monica Zucker, Assistant Principal • mzucker@cherrycreekschools.org