Time delay between hard X-ray and gamma ray lines observed by RHESSI during the 23 July event
Introduction. The 23 July event. Model. Time delay analysis. Time profile analysis. Conclusions. Time delay between hard X-ray and gamma ray lines observed by RHESSI during the 23 July event interpreted by a trap plus precipitation model. Cyril Dauphin. Nicole Vilmer.

Time delay between hard X-ray and gamma ray lines observed by RHESSI during the 23 July event
E N D
Presentation Transcript
Introduction The 23 July event Model Time delay analysis Time profile analysis Conclusions Time delay between hard X-ray and gamma ray lines observed by RHESSI during the 23 July event interpreted by a trap plus precipitation model Cyril Dauphin Nicole Vilmer LESIA observatoire de Meudon Time delay between hard X-ray and gamma ray lines observed by RHESSI during the 23 July event
Introduction The 23 July event Model Time delay analysis Time profile analysis Conclusions Delay of 12 s between hard X-ray flux at 150 keV and gamma ray lines Share et al, 2003 Correlation coefficients between X-ray flux at 150 keV and gamma ray flux during the impulsive part of the flare Origin of the delay: acceleration or transport effects? Time delay between hard X-ray and gamma ray lines observed by RHESSI during the 23 July event
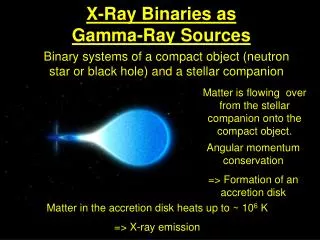
Introduction The 23 July event Model Time delay analysis Time profile analysis Conclusions X/ X/ Particle injection corona X/ chromosphere Can this delay be reproduced by a trap plus precipitation model ? • Principle of the model (Vilmer et al, 1982; Hulot et al, 1989): • -Electrons and ions have similar injection time profiles • Accelerated particles propagate into magnetic loops • Magnetic loops constitute a trap • Particles lose energy only by collisions in the trap Thin target Thick target Time delay between hard X-ray and gamma ray lines observed by RHESSI during the 23 July event
Introduction The 23 July event Model Time delay analysis Time profile analysis Conclusions Accelerated particle distribution function Acceleration Injection Corona: Density n0 constant >0 0defined by : Trap plus precipitation Strong diffusion Precipitation rate : Coulomb collisions losses Chromosphere Thick target Particle distribution function in the emitting regions Parameters of the model : , tmax ,q0, n0 , 02/L Time delay between hard X-ray and gamma ray lines observed by RHESSI during the 23 July event
Introduction The 23 July event Model Time delay analysis Time profile analysis Conclusions We compute the hard X-ray flux in the corona and in the chromosphere We compute the following gamma ray lines in the corona and in the chromosphere 12C+p 12C+ 16O+p 16O+ 24Mg+p 24Mg+ 1.364 MeV 4.438 MeV 28Si+p 28Si+ 1.779 MeV 16O+p 16O+ 6.129 MeV 20Ne+p 20Ne+ 1.634 MeV Time delay between hard X-ray and gamma ray lines observed by RHESSI during the 23 July event
Introduction The 23 July event Model Time delay analysis Time profile analysis Conclusions Hard X-ray flux at 150 keV =>temporal evolution of the injection First approach: impulsive part reproduced by a single parabola Spectral analysis of Lin et al, 2003 proton spectral index (mean value=3.75) Delay reproduced for 2/L=[10-7,3.10-6]n=[1010,2.1011] Time delay between hard X-ray and gamma ray lines observed by RHESSI during the 23 July event
Introduction The 23 July event Model Time delay analysis Time profile analysis Conclusions Second approach: reproduction of the 150 keV temporal evolution • 5 parabolic injections • tmax=37.5s, q1/q1=1 • tmax=20.5s , q1/q2=0.34 • tmax=44.5s , q1/q3=1.23 • tmax=45.5s , q1/q4=1.95 • tmax=31.5s , q1/q5=1.68 We determine the relative amplitude of each injection We use these injections to compute the X-ray at 1MeV and gamma ray flux time evolution Time delay between hard X-ray and gamma ray lines observed by RHESSI during the 23 July event
Introduction The 23 July event Model Time delay analysis Time profile analysis Conclusions Hard X-ray at 1 MeV1st step Hard X-ray radiation at 1 MeV is also due to electrons We kept the same q0/qi , we use= 4 (from Holman et al, 2003) free parameters are n and 2/L flux not correctly reproduced for a constant spectral index Time delay between hard X-ray and gamma ray lines observed by RHESSI during the 23 July event
Introduction The 23 July event Model Time delay analysis Time profile analysis Conclusions Hard X-ray at 1 MeV 2nd step We change the value of for each injection free parameters are n and 2/L 1=4.0,2=4.0, 3=4.01, 4=4.05, 5=4.02 • We found an evolution similar as Holman et al, 2003 • X-ray flux correctly reproduced with: • Best fit: • 1.1010 cm-3<n< 1.1011 cm-3 • 2/L=5.10-6 Time delay between hard X-ray and gamma ray lines observed by RHESSI during the 23 July event
Introduction The 23 July event Model Time delay analysis Time profile analysis Conclusions Gamma-ray lines flux 1st step =-3.75 (Lin et al, 2003), We kept the same q0/qi than for electrons free parameters are n and 2/L -ray flux not correctly reproduced for a constant spectral index and the injection amplitude of electrons Time delay between hard X-ray and gamma ray lines observed by RHESSI during the 23 July event
Introduction The 23 July event Model Time delay analysis Time profile analysis Conclusions Gamma-ray lines flux 2nd step =-3.75 (Lin et al, 2003) We change the ratio q0/qi for each injection, i.e. the number of electrons and ions accelerated in each injection is not necessarily the same • -ray flux correctly reproduced for a constant spectral index but the injection amplitude are different • Best fit: • - n=1.1010 cm-3 • 2/L=10-6 km-1 Time delay between hard X-ray and gamma ray lines observed by RHESSI during the 23 July event
Introduction The 23 July event Model Time delay analysis Time profile analysis Conclusions Ratio of electrons/ions for each injection Ratio of -ray production form the trap and the footpoints Even if there is trapping, emission come mainly from the footpoints Time delay between hard X-ray and gamma ray lines observed by RHESSI during the 23 July event
Introduction The 23 July event Model Time delay analysis Time profile analysis Conclusions • Delay between hard X-ray flux and gamma ray lines flux observed by RHESSI during the 23 July 2002 can be explained by a trap plus precipitation model for the first impulsive peak. • electrons are found to be injected in a region of high precipitation rate. X-ray radiation produce as in a thick target approximation • Ions are found to be injected in a region of lower precipitation rate Le<Lp - Ions and electrons are found to propagate in a loop of density in agreement with density of SXR loops observed by RHESSI at the beginning of the flare Time delay between hard X-ray and gamma ray lines observed by RHESSI during the 23 July event
Introduction The 23 July event Model Time delay analysis Time profile analysis Conclusions 23 July 2002: First gamma ray event observed by RHESSI Gamma-ray emitting ions not associated with the same loop system than X-ray emitting electrons (Hurford et al, 2004) Gamma ray lines Hard X-ray component Hurford et al, 2003 Lin et al, 2003 Time delay between hard X-ray and gamma ray lines observed by RHESSI during the 23 July event
Introduction The 23 July event Model Time delay analysis Time profile analysis Conclusions Second step: reproduction of the 150 keV temporal evolution 5 parabolic injections We use these injections to compute theX-ray at 1MeV and gamma ray flux Time delay between hard X-ray and gamma ray lines observed by RHESSI during the 23 July event