Download
1 / 62
620 likes | 730 Views
Gamma-ray jets, cocoons... and lines?!?. Douglas Finkbeiner & Meng Su, Harvard University Gamma 2012, Heidelberg July 10, 2012. I. Jets: Background:

E N D
Gamma-ray jets, cocoons... and lines?!? • Douglas Finkbeiner & Meng Su, • Harvard University • Gamma 2012, Heidelberg • July 10, 2012
I. Jets: • Background: • Based on a simple analysis of 1.6 years of Fermi data, we (Su, Slatyer, DPF) claimed in 2010 that there were “bubble” structures spanning ~ |b| < 50 deg and |l| < 20 deg.
I. Jets: • Background: • Based on a simple analysis of 1.6 years of Fermi data, we (Su, Slatyer, DPF) claimed in 2010 that there were “bubble” structures spanning ~ |b| < 50 deg and |l| < 20 deg. • Now with 3+ years of data, pass 7 events, and ULTRACLEAN event selection, we can see the structures more clearly, and can begin to investigate substructure.
Recall: Fermi bubbles processing steps: Point sources / diffuse model / stretch
Processing details: • Use Pass 7, 3 yr data, ultraclean events, bin to HEALPix maps • Point sources - use Fermi 2nd year catalog (2FGL), in-flight PSF estimate • Smooth to 1.5 or 2 degrees FWHM (spherical harmonic convolution) • Diffuse model • Fermi diffuse model • Pros: based (in part) on physical model, sophisticated • Cons: not sure what is in it, or how various artifacts might be introduced. • Simple model with geometric templates • Pro: Easy to see what is going on • Con: might be too simple-minded
Simple templates... • Our previous work used a uniform intensity template for the Fermi bubbles. • This was correct to zeroth order. Su & Finkbeiner (2010)
We also tried the Fermi diffuse model Data minus Fermi diffuse model in 4 energy bins. (1.6 yr data) Su & Finkbeiner (2010)
fainter brighter We always wondered why the left (east) part of the southern bubble was brighter, and if this was significant.
So we made another template... dust disk bubbles cocoon
“Cocoon” feature on east (left) side of southern bubble Su & Finkbeiner (2012)
The cocoon is detected as a distinct feature in the multilinear regression at 12 sigma. The spectrum is consistent with flat (in E2 dN/dE) L ~ 2x1036 erg/sec for 1-100 GeV Su & Finkbeiner (2012)
It is tempting to imagine that this “cocoon” contains a jet, but the jet must be very faint. Let’s look more carefully at 90 arcmin maps, binning counts from 0.8 to 3.2 GeV, after subtracting the usual templates (but not the cocoon)...
So we made yet another template... dust disk bubbles cocoon south jet
Loop I Disk Bubbles Su & Finkbeiner (2012)
Loop I Disk Bubbles Cocoon Jet Su & Finkbeiner (2012)
Fit is done for |b| > 20o Su & Finkbeiner (2012)
Now do this in each energy bin... Su & Finkbeiner (2012)
E2 dN/dE ~ E0.2 Su & Finkbeiner (2012)
Significance (over 0.3-300 GeV): • North jet: 3.1 sigma • South jet: 4.1 sigma • Jointly: 5.1 sigma • Cocoon: 12 sigma
Conclusions (Part I) • With significance levels like these, some people would claim a discovery. • We are calling this “evidence for” jets. We would like to see these confirmed at another wavelength. • Future all-sky x-ray data (eRosita) and microwave data (Planck) may clarify the situation. • See arXiv:1205.5852
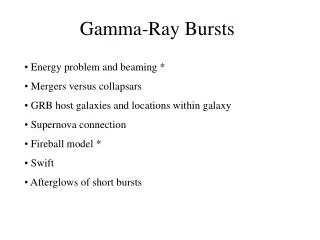
II. Gamma-ray lines • The LAT has many ways to search for dark matter, e.g.: • - Emission from dwarf Galaxies • - Emission from the Galactic center • - Line emission anywhere!
II. Gamma-ray lines • No astrophysical process can make a gamma-ray line.
II. Gamma-ray lines • No astrophysical process can make a gamma-ray line. • “Cold ultrarelativistic pulsar winds as potential sources of galactic gamma-ray lines above 100 GeV” • F. Aharonian, D. Khangulyan, D. Malyshev • As an existence proof - there is at least one such source of ultrarelativisitc cold particle beams in the Galaxy:
II. Gamma-ray lines • No astrophysical process can make a gamma-ray line. • “Cold ultrarelativistic pulsar winds as potential sources of galactic gamma-ray lines above 100 GeV” • F. Aharonian, D. Khangulyan, D. Malyshev • As an existence proof - there is at least one such source of ultrarelativisitc cold particle beams in the Galaxy:
Best limits so far: • The LAT collaboration has a recent paper posted • by Elliott Bloom (Ackermann et al., 1205.2739)
However, there have been hints of something at ~ 130 GeV (30 March, 2012)
Bringmann et al. • Looking for internal bremsstrahlung:
Next, Christoph Weniger weighed in with a solo paper looking for a 130 GeV line:
In fact, a line fits better than the VIB in Bringmann et al.
This led the theorists to wonder if there is more than one line... (21 May, 1205.4723)
Timeline of 130 GeV line: • 12 April - Weniger (looks like a line at 130 GeV) (22 citations) • 26 April - Profumo & Linden (is it the Fermi bubbles?) • 10 May - Tempel et al., (No, it’s not a bubble, could be DM) • 21 May - Boyarsky (lots of blobs, probably not DM) • 25 May - Acharya, Kane... (It’s a Wino) • 29 May - Bergstrom (reviews claims as part of larger review) • 30 May - Jim Cline (two lines) • 30 May - Buckley & Hooper (theoretical models) • 5 June - Geringer-Sameth & Koushiappas (Line search in dwarfs) • 7 June - Su & Finkbeiner (Off center 1.5 deg, Einasto, 6.5 sigma, use high energy-resolution events) • 13 June - Weiner & Yavin (MiDM explains it) • (and 21 other papers...)
There is a blob in the Galactic center at ~ 130 GeV. How do extract its spectrum? • Make maps in each of 16 energy bins, assume that emission in each bin is a linear combination of template maps, and plot the template coefficients. • Coefficients are determined by maximizing the Poisson likelihood of observing the observed counts given the model. • Templates choice corresponds to hypothesis to be tested.
Uncertainty of each coefficient is determined from the curvature matrix of the likelihood surface. • The significance of the 110-140 GeV bins sums (in quadrature) to 6.5 sigma (local). • The fit prefers a line at 127 +/- 2 GeV • or (slightly better) two lines at 111 and 129 GeV.
There are very few photons, but we can project in Gal. longitude bins and look for a bump:
There is a bump... but offset by 1.5 deg in longitude. TS=36, which naively implies 6.0 sigma. Allowing for 3 new d.o.f., 5.25 sigma.