Download
1 / 17
170 likes | 253 Views
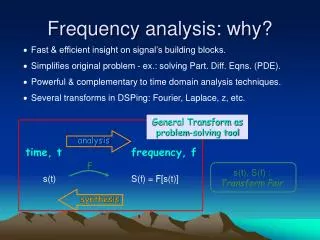
Frequency Analysis and Data. Reading: Applied Hydrology Sections 12.3-12.6.

E N D
Frequency Analysis and Data Reading: Applied Hydrology Sections 12.3-12.6
Hydrologic extremes • Extreme events • Floods • Droughts • Magnitude of extreme events is related to their frequency of occurrence • The objective of frequency analysis is to relate the magnitude of events to their frequency of occurrence through probability distribution • It is assumed the events (data) are independent and come from identical distribution
Return Period • Random variable: • Threshold level: • Extreme event occurs if: • Recurrence interval: • Return Period: Average recurrence interval between events equalling or exceeding a threshold • If p is the probability of occurrence of an extreme event, then or
More on return period • If p is probability of success, then (1-p) is the probability of failure • Find probability that (X ≥ xT) at least once in N years.
Upper Brushy Creek Hydrologic Model Jeff Irvin, URS
Hydrology: the Mindset Hydrology = Data (Rainfall, Runoff, Land Use) Data bad = Hydrology bad Data good = Hydrology good How do you test data?
Choice of Calibration storms The runoff hydrograph has two main parameters that define shape: • A parameter that defines how much rain runs off (runoff volume) • A parameter that defines time of peak (runoff temporal shape)
Choice of Calibration Storms: Storm of 2007 Representative in location and time? Are there enough data? • Spatially vs storm shape
Choice of Calibration Storms: TS Hermine Are there enough data? • Spatially vs storm shape
Choice of Calibration Storms Representative? • In temporal shape TS Herminevs SCS 24 hour hyetograph 2007 Storm vs SCS 24 hour hyetograph
Antecedent Moisture Condition p. 149 Applied Hydrology http://www.wcc.nrcs.usda.gov/ftpref/wntsc/H&H/CNarchive/CNbeyond.doc
Why are results inconsistent? Can we compare 2007 storm runoff results to 2012 storm runoff results? Are the conditions that affect runoff homogeneous between the two storms? Rainfall Land Use Soil Type % Impervious Antecedent Runoff Condition
Antecedent Runoff Are the two storms homogeneous in terms of antecedent conditions? 2007 Rainfall 2010 Rainfall
Results of Rainfall/Runoff Calibration Antecedent Runoff Condition 1 (Dry) Antecedent Runoff Condition 2 (Normal)