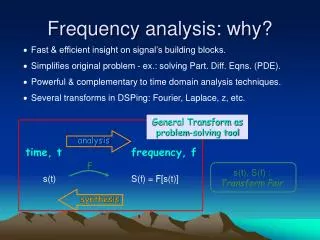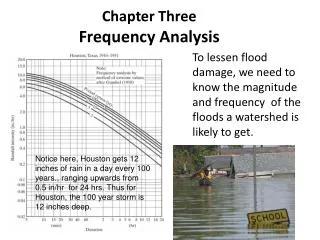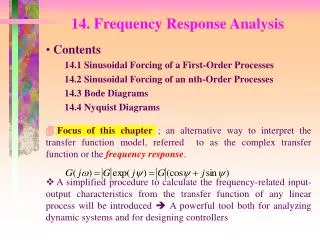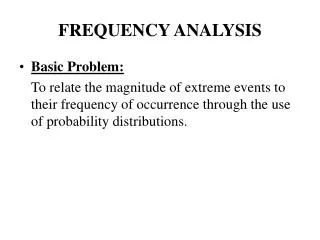
Frequency Analysis
Frequency Analysis. Reading: Applied Hydrology Sections 12-2 to 12-6. Frequency analysis for extreme events . Q. Find a flow (or any other event) that has a return period of T years. EV1 pdf and cdf. Define a reduced variable y.


Frequency Analysis
E N D
Presentation Transcript
Frequency Analysis Reading: Applied Hydrology Sections 12-2 to 12-6
Frequency analysis for extreme events Q. Find a flow (or any other event) that has a return period of T years EV1 pdf and cdf Define a reduced variable y If you know T, you can find yT, and once yT is know, xT can be computed by
Example 12.2.1 • Given annual maxima for 10-minute storms • Find 5- & 50-year return period 10-minute storms
fX(x) x Frequency Factors • Once a distribution has been selected and its parameters estimated, then how do we use it? • Chow proposed using: • where
Normal Distribution • Normal distribution • So the frequency factor for the Normal Distribution is the standard normal variate • Example: 50 year return period Look in Table 11.2.1 or use –NORMSINV (.) in EXCEL or see page 390 in the text book
Example 12.3.2 • Given annual maximum rainfall, calculate 5-yr storm using frequency factor
Probability plots • Probability plot is a graphical tool to assess whether or not the data fits a particular distribution. • The data are fitted against a theoretical distribution in such as way that the points should form approximately a straight line (distribution function is linearized) • Departures from a straight line indicate departure from the theoretical distribution
Normal probability plot • Steps • Rank the data from largest (m = 1) to smallest (m = n) • Assign plotting position to the data • Plotting position – an estimate of exccedance probability • Use p = (m-3/8)/(n + 0.15) • Find the standard normal variable z corresponding to the plotting position (use -NORMSINV (.) in Excel) • Plot the data against z • If the data falls on a straight line, the data comes from a normal distributionI
Normal Probability Plot Annual maximum flows for Colorado River near Austin, TX The pink line you see on the plot is xT for T = 2, 5, 10, 25, 50, 100, 500 derived using the frequency factor technique for normal distribution.