Download

1 / 54
590 likes | 1.61k Views
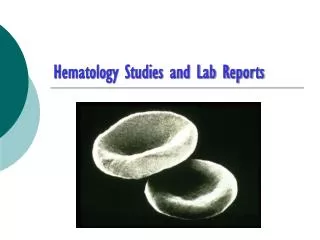
Hematology Studies and Lab Reports. Normal Blood Cells:. THE WBC. Identify the segmented neutrophil, band neutrophil, lymphocyte, monocyte, eosinophil, basophil, and platelet in the image. band neutrophil , eosinophil, segmented neutrophil lymphocyte, basophil, monocyte, .

E N D
THE WBC Identify the segmented neutrophil, band neutrophil, lymphocyte, monocyte, eosinophil, basophil, and platelet in the image
band neutrophil, eosinophil, segmented neutrophil lymphocyte, basophil, monocyte,
Bone Marrow Cellularity: Normal Hypercellular Hypocellular
The red blood cells here are normal, happy RBC's. They have a zone of central pallor about 1/3 the size of the RBC. The RBC's demonstrate minimal- variation in size (anisocytosis) and shape (poikilocytosis). A few small fuzzy blue platelets are seen. In the center of the field are a band neutrophil on the left and a segmented neutrophil on the right. Normal RBC
Steps in Erythropoisis Early Intermediate Late Proerythroblast (Pronormoblast) Polychromatophilic Normoblast Reticulocyte Basophilic Normoblast Orthochromatophilic Normoblast Erythrocyte
HCT (Hematocrit) (114) • The packed cell volume (HCT) is the percentage of total volume occupied by packed red blood cells when a given volume of whole blood is centrifuged at a constant speed for constant period of time. The HCT is one of the most precise methods of determining the degree of anemia or polycythemia. Plasma(55% of whole blood Buffy coat: leukocyctes and platelets(<1% of whole blood Erythrocytes(45% of whole blood)
MCH (149) • (Mean Corpuscular Hemoglobin): Indicates the weight of hemoglobin in a single red blood cell. • MCH increase or decrease along with an increase or decrease in MCV is a significant finding if there is a need for folic acid and/or B12 • A decrease in MCH with a decrease in MCV indicates a need for iron, copper, or B6.
MCV (150) • (Mean Corpuscular Volume): This measurement indicates the volume in cubic micron occupied by an average single red blood cell. MCV increase or decrease along with an increase or decrease in MCH is a significant finding for folic acid and/or B12 need (increase) or iron, copper or B6 need (decrease). MCV and MCH should always be viewed together.
Complete Blood Count (85) • WBC: Total and differential counts • RBC: • HGB (Hemoglobin): • HCT (Hematocrit): • MCV (Mean Corpuscular Volume): • MCH (Mean Corpuscular Hemoglobin): • MCHC (Mean corpuscular hemoglobin concentration): • PLATELETS: Platelets are concerned with the clotting of the blood and also clot retraction.
WBC :Differential Count (220) • SEG : A type of neutrophil, its primary function is phagocytosis. • BANDS: Non-segmented neutrophils (metamylocytes) the youngest forms that are normally found in the peripheral blood. These forms increase in the presence of acute infections with or without an absolute increase in the total WBC.
WBC :Differential Count • LYMPH : Lymphocytes help to destroy the toxic products of protein metabolism. Lymphocytes originate from lymphoblasts in the spleen, lymph glands, tonsils, thymus, bone marrow, and possibly the appendix. • NK cell
WBC :Differential Count • MONO : monospot test (125) EBV antibodies (95) Monocytes phagocytize some bacteria, particulate matter, and protozoa. The monocytes remain to phagocytize fragments of cells, etc; hence, the reason for an elevation of the monocytes during the recovery phase of infection.
The WBC's seen here are "atypical" lymphocytes. They are atypical because they are larger (more cytoplasm) and have nucleoli in their nuclei. The cytoplasm tends to be indented by surrounding RBC's. Such atypical lymphocytes are often associated with infectious mononucleosis.
WBC :Differential Count EOS : Eosinophils have an important role in detoxification, disintegration and removal of protein. Eosinophils are commonly elevated in allergy sensitivity and parasites.
WBC :Differential Count • BASO : • With inflammation, basophils deliver heparin to the effected tissue to prevent clotting.
The nucleated RBC in the center contains basophilic stippling of the cytoplasm. This suggests a toxic injury to the bone marrow, such as with lead poisoning.
This is sickle cell anemia in sickle cell crisis. The abnormal hemoglobin SS is prone to crystallization when oxygen tension is low, and the RBC's change shape to long, thin sickle forms that sludge in capillaries, further decreasing blood flow and oxygen tension. Persons with sickle cell trait (Hemoglobin AS) are much less likely to have this happen.
VITAMIN B-12: (216)FOLIC ACID: (105) • Pernicious anemia is the megaloblastic anemia caused by malabsorption of Vitamin B12. This is usually caused by decreased production of intrinsic factor, a substance essential to Vitamin B12 absorption, in the stomach. This test may also be performed as part of the testing to determine the cause of nervous system disorders. • Folic acid (folate) is one of the "B" vitamins needed to metabolize homocysteine. Vitamin B12, another B vitamin, helps keep folate in its active form, allowing it to keep homocysteine levels low.
Megaloblastic anemia: • Vitamin B12/Folic acid deficiency • Second most common type of anemia. • Multi System disease – All organs with increased cell division. • Macrocytic anemia, pancytopenia. • Pernicious anaemia – • autoimmune, Gastric atrophy, VitB12 def.
Vitamin B12 Absorption B12 Parietal cells - produce Intrinsic Factor B12 Stomach IF Ileum - IF receptors IF B12 B12 IF B12 absorption
SCHILLING TEST • Assesses ability of terminal ileum to absorb vitamin B12 • Oral preparation of vitamin B12 tagged with Co-57 • Prior to this ‘normal vitamin B12 injection is given to facilitate excretion of oral B12 administered • Test measures how much of this radioactive isotope is excreted in urine • May be given with Inrinsic factor as well to see if excretion in urine increases. • In pernicious anemia patients • Without Intrinsic factor the excretion is less than7% • When given intrinsic factor tagged B12 is given the excretion rate is greater then 7-20% • If both are low then it may suggest other cause for malabsorption
Anemia with high Reticulocyte counts (186) • Differential diagnosis: • Bleeding – blood loss internal/external • Hemolysis – immune, mechanical, toxic, inf. • Laboratory evaluation • Blood film, nRBC, spherocytes, Parasites, Retics. • Hemolysis – indirect Bilirubin, Haptoglobin, • Direct and indirect Coombs test • Hemoglobin electrophoresis, G6PD screen etc.
Anemia with Low MCV and Low Retics • Differential diagnosis • Iron deficiency • Anemia of chronic disease • Laboratory evaluation • Serum Iron levels, iron-binding capacity, and ferritin • Blood smear – Micro/hypo, Pencil cells.
C.B.C • Haemoglobin - 15±2.5, 14 ±2.5 - g/dL • PCV - 0.47 ±0.07, 0.42 ±0.05 - l/dL (%) • Haematocrit, effective RBC volume - better • RBC count - 5.5 ±1, 4.8 ± 1 x10¹²/L • MCHC - Hb/PCV - 30-36 - g/dL • Hb synthesis within RBC • MCH - Hb/RBC - 29.5 ± 2.5 pg/L • Average Hb in RBC • MCV - PCV/RBC 85 ± 8 - fL
The CBC here shows a markedly increased MCV, typical for megaloblastic anemia. The MCV can be mildly increased in persons recovering from blood loss or hemolytic anemia, because the newly released RBC's, the reticulocytes, are increased in size over normal RBC's, (399)
Anemia Screen (398-400) • IRON: • IRON BINDING CAPACITY: • PERCENT OF IRON SATURATION: Measurement of iron in serum. • FERRITIN: • TRANSFERRIN: • VITAMIN B-12: • FOLIC ACID:
Management of Oral Anticoagulant Therapy Principles & Practice (98-99,488)
Fibrinolysis Coagulation and Fibrinolysis Coagulation Factors t-PA, Urokinase Fibrinogen Plasminogen PAI-1 Fibrin Plasmin Lp(a) Homocysteine Cysteine Glutathione
Prothrombin Time (PT) (182) • Historically, a most reliable and “relied upon” clinical test However: • Proliferation of thromboplastin reagents with widely varying sensitivities to reduced levels of vitamin K-dependent clotting factors has occurred • Concept of correct “intensity” of anticoagulant therapy has changed significantly (low intensity) • Problem addressed by use of INR (International Normalized Ratio)
INR: International Normalized Ratio • A mathematical “correction” (of the PT ratio) for differences in the sensitivity of thromboplastin reagents • Relies upon “reference” thromboplastins with known sensitivity to antithrombotic effects of oral anticoagulants • INR is the PT ratio one would have obtained if the “reference” thromboplastin had been used • Allows for comparison of results between labs and standardizes reporting of the prothrombin time J Clin Path 1985; 38:133-134; WHO Tech Rep Ser. #687 983.
INR Equation ( ) ISI Patient’s PT in Seconds Mean Normal PT in Seconds INR = INR = International Normalized Ratio ISI = International Sensitivity Index
How Different Thromboplastins Influence the PT Ratio and INR Blood from a single patient Patient’s PT (Seconds) Mean Normal (Seconds) ThromboplastinReagent PTR ISI INR 16 A 12 1.3 18 B 12 1.5 21 C 13 1.6 24 D 11 2.2 E 38 14.5 2.6
How Different Thromboplastins Influence the PT Ratio and INR Blood from a single patient Patient’s PT (Seconds) Mean Normal (Seconds) Thromboplastinreagent PTR ISI INR 16 A 3.2 12 1.3 2.6 18 B 12 1.5 2.4 2.6 21 C 13 1.6 2.0 2.6 24 D 11 2.2 1.2 2.6 E 38 14.5 2.6 1.0 2.6
Bleeding Disorders (408-409) Hemophilia Von Willebrand Disease (vWD)
Coagulation Process • Stage 1: Release of platelet factors to initiate clotting • Stage 2: Generation of Thromboplastin by other factors • Stage 3: Conversion of prothrombin to thrombin • Stage 4: Formation of fibrin from fibrinogen