Download
1 / 27
270 likes | 361 Views
Explore the process of earthquake recording, seismic waves, fault lines, and measurement scales. Learn to interpret seismograms and understand P-waves and S-waves. Engage in class discussions to deepen knowledge. Watch the provided video and complete the earthquake video worksheet.

E N D
How are Earthquakes Recorded? Educational Materials and Videos are made by: Giovanna Perrone and Alexandra Mair SEYS 753 Spring 2008 Professor Brain Murfin
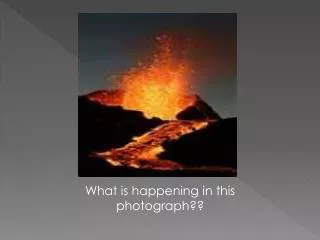
Dynamic Crust The following clip is a demonstration of how earthquakes occur and they are recorded. Using the following worksheet, earthquake video worksheet,answer the questions using the information from the video. After the video, have a class discussion on the notes as the lesson will reiterate the concepts of the video.(click the warning to begin the video) • Do Now: • Watch the following clip and describe what you are seeing. • http://www.youtube.com/watch?v=m9RF5eRdG9c
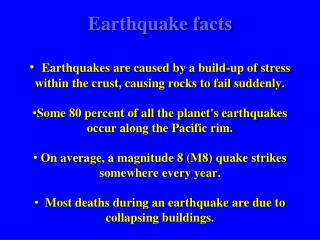
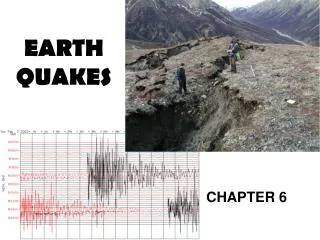
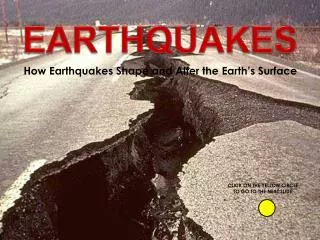
Earthquakes Fault: it is the first place where movement occurs between the plates A fault line is where an earthquake occurs • Earthquakes: a violent shaking of the earth’s crust caused by the movement of landmasses along faults and/or subduction zones
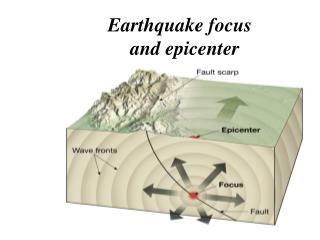
Earthquakes • Seismic Waves: Seismic waves the energy that an earthquake release and goes in ALL DIRECTIONS Epicenter: is the location on the earth’s surface that is directly above the focus of an earthquake. This is where the seismic waves first reach the surface.
Richter Scale • The Richter scale is widely used to measure the magnitude (or the amount) of energy of an earthquake. There is no limit as to how strong an earthquake may be.
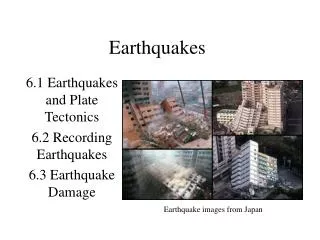
Mercalli Scale • Mercalli Scale is used to determine how much observable damage, also called the intensity, was done by an earthquake
Seismograph vs. Seismogram • Seismographis an instrument that is used to detect (measure) seismic waves • Seismic waves are recorded on a seismogram • A seismogram is a piece of paper that records seismic waves http://www.thetech.org/exhibits/online/quakes/seismo/images/seismograph.gif
How to Read a Seismogram http://ww2.lafayette.edu/~malincol/Geol120/earthquaketopics.html
Earthquake Waves • P-waves – also called primary waves, or compressional waves • P-waves travel faster • They always reach the seismic stations first • P-waves cause particles to vibrate back and forth in the direction that a P-wave moves (← →) • P-waves can travel through solids, liquids, and gases
Earthquake Waves • S-waves – also called secondary waves, or shear waves. • S-waves travel slower than P-waves and reach seismic stations second. • S-waves cause particles to vibrate at right angles (up and down motion) to the direction that S-waves move. (↑↓) • S-waves can only travel through solids - NEVER through liquids
Shadow Zones Shadow zones are created due to secondary waves cannot pass through the liquid outer core. These are areas where no seismic recording occurs.
Calculating P-Wave and S-Waves
Notice the vertical axis This represents TIME (in minutes!) Let’s enlarge a small section
Between each minute, we notice that there are 3 segments. If there are 60 seconds in a minute, each one of these segments must be ________seconds. 20
What would this time be? 2 minutes, 20 seconds
Notice the horizontal axis This represents DISTANCE (in thousands of Kilometers!) Let’s enlarge a small section
1,000km 2,000km 1,200km 1,800km So what would this distance be? 1,400km 1,600km Fill these in... 5,400km
There are also two curves on this chart that display the way different earthquake waves behave.
S-Wave P-Wave
This chart can be used for answering many different questions! Let's try a few examples How long does it take an S-Wave to travel 5,000km? Go to the chart!
Another example... The recording station tells us it took 6 minutes and 20 seconds for the P-Wave to reach them. How far away from the epicenter of the earthquake must they be? Go to the chart!
Another example... I know that there was a 7 minute difference in the arrival of my P and S waves. How far away from the epicenter must I be? Go to the chart!
Slide your scrap paper up until the tick marks match up with the curves… 5,200km Mark off 7 minutes on scrap paper…