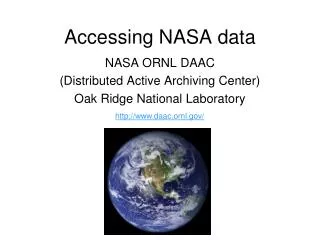
Accessing NASA data
Accessing NASA data. http://www.daac.ornl.gov/. NASA ORNL DAAC (Distributed Active Archiving Center) Oak Ridge National Laboratory. NASA Observing Spacecraft for Earth System Research. Moderate Resolution Imaging Spectroradiometer (MODIS). How a Polar Orbiting Satellite orbits…. Haze.


Accessing NASA data
E N D
Presentation Transcript
Accessing NASA data http://www.daac.ornl.gov/ NASA ORNL DAAC (Distributed Active Archiving Center) Oak Ridge National Laboratory
NASA Observing Spacecraft for Earth System Research Moderate Resolution Imaging Spectroradiometer (MODIS)
Haze Cloud Sunglint Data provided by NASA Goddard Space Flight Center. Image processed by Battelle using MODIS HDF Look.
MODIS Aerosol Optical Depth25 June 2002 Data provided by NASA Goddard Space Flight Center. Image processed by Battelle using MODIS HDF Look.
The Earth Observing System (EOS) Program • NASA’s Earth Observing System (EOS) Program • centerpiece of NASA’s Earth Science Directorate, largest component in the U.S. Climate Change Science Program • spaced-based observing system • ground-based field campaigns • objective is to enable quick and easy access to data about the earth • EOS Data and Information System (EOSDIS) • explicitly planned and funded by NASA to make maximum use of the data • data available at 8 Distributed Active Archive Centers (DAACs), organized by scientific discipline EOSDIS Archive
GSFC EDC SEDAC Upper Atmosphere, Global Biosphere, and Geophysics U. Colorado Land Processes Socio-economic JPL Cryosphere Ocean Circulation And Air-sea Interaction U. Alaska Sea Ice and Polar Processes LaRC Atmospheric Processes ORNL Biogeochemical Dynamics EOSDIS Distributed Active Archive Centers
Getting data from Data Centers • Directly from Data Centers websites • Center-unique search-and-order systems • Specialized data set tools • Viewing, subsetting, web GIS • EOS Data Gateway (EDG)- A NASA site where one can search across all the NASA data centers and also order (soon to be replaced by another system called ECHO). Has browse capability. http://eos.nasa.gov/imswelcome • Global Change Master Directory – Allows one to search across all the NASA data centers plus many other data sites. Over 2,400 providers. Points you to where to order. ( but is not the place to order.) http://gcmd.nasa.gov • Many of the data sets require special tools for image processing and analysis. These tools are provided by the data centers and are under continual development.
http://ghrc.msfc.nasa.gov/ http://datapool.nsstc.nasa.gov
EOS Data Gateway http://eos.nasa.gov/imswelcome
ORNL DAAC ~ Distributed Active Archive Center http://www.daac.ornl.gov/ • Mission: Support the needs of NASA’s Earth Science Enterprise (ESE) and Earth Observing System (EOS) Program by assembling, archiving, and distributing terrestrial biogeochemistry and ecosystem dynamics data • Sponsor: NASA • Martha Maiden - EOSDIS • Diane Wickland - Earth System Science – Carbon Cycle and Ecosystems • Is not responsible for satellite downloading. Does get satellite data from other NASA data centers… and then puts it in a format accessible to ecological field researchers.
LBA LBA BOREAS S2K S2K LAI/fPAR NPP LAI/fPAR NPP ORNL DAAC: Roles in EOS Four primary data management roles, supporting: 1. Field Campaigns 2. Validation of Remote Sensing Products • 6-9 year intensive study of a region: • Amazon (LBA) • Canada (BOREAS) • Southern Africa • (SAFARI 2000) In-situ Observations Remote Sensing ? 4. Model Code* 3. Regional and Global Studies* • Benchmark Models • IBIS, BIOME-BGC, LSM • Manuscript Models • PNeT, Century, Biome-BGC • Climate • Soils • Vegetation • Hydroclimatology
ORNL DAAC data sets & renewable energy? • Regional & global data relevant to hydropower • Climate collections - Several global climate data sets. Climate data include measured and modeled values for variables such as temperature, precipitation, humidity, radiation, wind velocity, and cloud cover • Hydroclimatology collections - data on streamflow and climatology. The data were collected with a range of frequencies (daily and monthly) and are from meteorological and streamflow discharge stations in the U.S. • River discharge - The Global River Discharge (RivDIS) data set contains monthly discharge measurements for 1018 stations located throughout the world. The period of record varies widely from station to station, with a mean of 21.5 years.
ORNL DAAC data sets & renewable energy? • Regional & global data relevant to bioenergy • Climate collections - Several global climate data sets. Climate data include measured and modeled values for variables such as temperature, precipitation, humidity, radiation, wind velocity, and cloud cover • Soil Collection - data on the physical and chemical properties of soils, including soil carbon and nitrogen, soil water-holding capacity, soil respiration, and soil texture. The data are gridded at spatial scales ranging from regional to global. • Vegetation Collections - Gridded data on vegetation from regional to continental scales. Information about vegetation data archived at the ORNL DAAC is available on the Leaf Area Index Web page. The DAAC also offers data from the Net Primary Productivity Database, which contains biomass and NPP estimates.
MODIS ASCII Subsets: Remote Sensing Products for Field Sites Bob Cook, Steve Margle, Susan Holladay, and Suresh Kumar ORNL DAAC Oak Ridge National Laboratory Distributed Active Archive Center Oak Ridge, Tennessee, USA
MODIS ASCII Subsets (Coll. 4) • Subsets of Terra and Aqua MODIS Land Products for 280 sites worldwide (field sites or flux towers) in ASCII format • 7 km x 7 km centered on flux tower or field sites • Two annual products, four 8-day products, two 16-day products, and calculated albedo, from 2000 to present
Location Dec 02 Jan 03 Feb 02 Mar 02 Apr 02 Location from Google maps Greenup (Above images) – Matches with time series * Images from USGS Global Visualization Viewer http://glovis.usgs.gov/ Also 2001, seems to be a special case – Scope for further analysis NDVI Time series for cropland in Michigan
FTP – most popular method Picklists Site, investigator, land cover class, network WebGIS Site location plus background layers GeoTIFF file picklist with WebGIS Google Earth MODIS Subset metadata file that opens in Google Earth application Multiple paths to access data
Pixel Values Mean Value of Pixels Percent of Pixels that meet QC Criteria LAI at Lost Creek NDVI at Lost Creek Using Google Earth to Access Subsets
Pixel Values Mean Value of Pixels Percent of Pixels that meet QC Criteria NDVI Albedo (Visible) Beginning to compile site data for comparison
Acquisition and Processing of MODIS Tiles: Tool for North America ORNL DAAC LP DAAC Automatic FTP pull from Data Pool MODIS Data Pool MODIS Reprojection Tool: Conversion to Binary ORNL Code: Conversion to ASCII Inventory Inventory HDF Tiles ASCII tiles (per SDS) Temporary 1200 x 1200 km Files for User Interface Computer Resources Dedicated Server 10 TB RAID storage (capacity through 2009 for 1.5 TB/y) SDS = Science Data Set
User Interface • User selects center coordinates or site, areal extent, and period of interest • Processing of time series (selection of tiles, mosaicking, generating time series data file and graphs) takes 10 to 60 minutes for most products (depends on area, time period, and product) • URL with graphs and pointers to data files is emailed to user
Center Pixel Mean Value of Pixels Percent of Pixels that meet QC Criteria Time SeriesExample EVI Southern California
Center Pixel Mean Value of Pixels Percent of Pixels that meet QC Criteria Time SeriesExample Mean (std dev) for pixels with same land cover as the center pixel (20 of 49 pixels) Center pixel = Woody Savannas
Importing ASCII Grid Data into GIS/Image processing software • Table of Contents • Importing data into: • ArcGIS 9.x • ENVI • ArcView 3.x • GRASS Prepared by Suresh Kumar on March 10th 2006, ORNL DAAC
Importing the ASCII Grid data into ArcGIS 9.x Go to Table of Contents Prepared by Suresh Kumar on March 10th 2006, ORNL DAAC
Example File : GRID.MOD13A2.asc MODIS ASCII Subsets: Data Visualization [MOD13A2] Terra Vegetation Indices (NDVI, EVI) USA, Walker Branch Watershed, Oak Ridge, Tennessee Centered on Latitude [35.958767] Longitude [-84.287433] 7 Kilometers [7 Pixels] Wide and 7 Kilometers [7 Pixels] High Requested Time Span November 2005 to November 2005 For a PRJ file, access http://daac.ornl.gov/cgi-bin/MODIS/GR_common/modis.prj For a prj.adf file, access http://daac.ornl.gov/cgi-bin/MODIS/GR_common/prj.adf MODIS HDF Tile MOD13A2.A2005305.h11v05.004.2005325075111.hdf -----START Scientific Data Set (Band): 1_km_16_days_NDVI, MODIS Date: A2005305 (Nov. 1, 2005)----- ncols 7 nrows 7 xllcorner -7589988.98 yllcorner 3995608.83 cellsize 926.62543305583381 nodata_value -9999999 5579 5846 5940 5769 5566 5869 5776 6173 5722 5876 5912 5920 5882 5632 5844 5812 5972 5904 5154 4966 5282 5786 5765 5822 5695 5739 5817 5992 5609 5094 4333 5790 5763 5793 5863 5602 5499 5844 5811 5210 5436 5728 4749 5674 5419 2617 4012 5607 5219 -----END Scientific Data Set (Band): 1_km_16_days_NDVI, MODIS Date: A2005305 (Nov. 1, 2005)----- MODIS HDF Tile MOD13A2.A2005321.h11v05.004.2005342022515.hdf -----START Scientific Data Set (Band): 1_km_16_days_NDVI, MODIS Date: A2005321 (Nov. 17, 2005)----- ncols 7 nrows 7 xllcorner -7589988.98 yllcorner 3995608.83 cellsize 926.62543305583381 nodata_value -9999999 5279 5480 5584 5584 5226 5248 5275 5781 5508 5517 5383 5347 5281 5051 5634 5554 5571 5511 4825 4557 5344 5635 5375 5293 5432 5298 5562 5581 5386 4646 4660 5279 5446 5480 5393 5396 5118 5750 5563 4825 5260 5587 4774 5425 5047 3500 4174 5187 4955 -----END Scientific Data Set (Band): 1_km_16_days_NDVI, MODIS Date: A2005321 (Nov. 17, 2005)----- Prepared by Suresh Kumar on March 10th 2006, ORNL DAAC
Step 1 Copy contents between “-----START Scientific Data Set (Band)…………..” And “-----END Scientific Data Set (Band)……………...” Into a separate file. If there are more than one START-END entries, copy contents within each of the START-END statements into individual files like: File GRID_MOD13A2_A2005305 _1_km_16_days_NDVI.asc from example file GRID.MOD13A2.asc ncols 7 nrows 7 xllcorner -7589988.98 yllcorner 3995608.83 cellsize 926.62543305583381 nodata_value -9999999 5579 5846 5940 5769 5566 5869 5776 6173 5722 5876 5912 5920 5882 5632 5844 5812 5972 5904 5154 4966 5282 5786 5765 5822 5695 5739 5817 5992 5609 5094 4333 5790 5763 5793 5863 5602 5499 5844 5811 5210 5436 5728 4749 5674 5419 2617 4012 5607 5219 Prepared by Suresh Kumar on March 10th 2006, ORNL DAAC
Step 2 Importing the individual file GRID_MOD13A2_A2005305 _1_km_16_days_NDVI.asc into ArcGIS : Using ArcToolbox from ESRI’s ArcGIS 9.x software Select: Conversion Tools To Raster ASCII to Raster Prepared by Suresh Kumar on March 10th 2006, ORNL DAAC
Step 3 Provide path to ASCII file (GRID_MOD13A2_A2005305 _1_km_16_days_NDVI.asc) and Output Raster (MD13A205305) Click OK Prepared by Suresh Kumar on March 10th 2006, ORNL DAAC
Step 4 After converting to Raster the output raster (MD13A205305) would automatically load into ArcMap Prepared by Suresh Kumar on March 10th 2006, ORNL DAAC
Step 5 Export this file (MD13A205305) into ArcGIS GRID Right Click on the file to Export Provide output filename (e.g. md13a2053051) and format Prepared by Suresh Kumar on March 10th 2006, ORNL DAAC
Step 6 Setting up the projection Download file prj.adf from http://daac.ornl.gov/cgi-bin/MODIS/GR_common/prj.adf copy the prj.adf file into the GRID file directory (md13a2053051) created in the previous step Prepared by Suresh Kumar on March 10th 2006, ORNL DAAC
Step 7 Load the GRID file in ArcMap – Make sure that the projection is defined on the dataset Final output md13a2053051 with projection set, overlaid with the MODIS site locations If the projection isn't defined, use the following file to define the projection. Download file modis.prj from http://daac.ornl.gov/cgi-bin/MODIS/GR_common/modis.prj Copy this file into <ESRI installation Folder>\Coordinate Systems\Projected Coordinate Systems\World\Sphere-based and manually set the projection for the file Prepared by Suresh Kumar on March 10th 2006, ORNL DAAC