Download
1 / 20
200 likes | 369 Views
Case Studies in EI Measurement: Fathom Five & Banff National Parks. Gilles Seutin Parks Canada World Park Congress 2003. Summary. Monitoring at Parks Canada Fathom Five National Park Banff National Park Challenges Lessons Learned. Monitoring at Parks Canada.

E N D
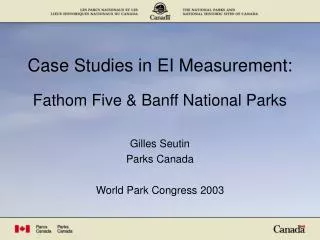
Case Studies in EI Measurement:Fathom Five & Banff National Parks Gilles Seutin Parks Canada World Park Congress 2003
Summary • Monitoring at Parks Canada • Fathom Five National Park • Banff National Park • Challenges • Lessons Learned
Monitoring at Parks Canada • Currently more than 700 projects • Increase over the last 10 years • In general: • Ad-hoc, project-based • Poor indicators of overall park management objectives/effectiveness • Weak links to greater ecosystem monitoring
Project Management Plan Recommendations for adjustments measurable targets Output monitoring Project Report From Project Outputs…
Park Management Plan assessment and recommendations measurable management targets EI monitoring State of Park Report … to Management Outcomes
Bruce/Fathom Five Ecosystem Great Lakes Ecosystem
Ecological Sustainability Physical Chemical Biological Social WaterLevel Water Quality Species at Risk Visitor Use 1 indicator 5 indicators 2 indicators 2 indicators • Reason • Affect nearshore aquatic habitat • Target • 0 new crib docks • no loss of fish habitat Shoreline Dev. Invasive Species Education 2 indicators 1 indicator 2 indicators Residential Dev. Lower Trophic Partnerships 2 indicators 2 indicators Dock Facilities Fish Population Cultural Resources 3 indicators 1 indicator FFNP – Monitoring Framework
Target Target: 50% of long- term fire cycle BNP – Indicators Objective:Maintain and restore native vegetation communities Indicator: Area burned
Comparison • Fathom Five NP: • Linked to ecoregional monitoring • Comprehensive • Good communication of results • Banff NP: • Linked to management objectives • Targeted • Uses conceptual models by ecosystem • Both: • Few monitoring targets
PARK MONITORING PROGRAM • comprehensive assessment of park EI • medium to long term results (> 10 years) • monitoring framework/EIS provides direction Monitoring of Core EI Indicators Challenge: Comprehensiveness • direct management-related issues • short term results (2003-2008) • PMP provides direction, active management Monitoring of Mgnt. Issues
Typical Indicators water/air quality, AVHRR, phenology, land use changes National (System-wide) focal species, ecosystem monitoring, fragmentation Bio-Regional (Ecozone) PMP-driven indicators, local human use issues Local (Park-specific) Challenge: Coordination
Lessons Learned • Need linkages to management objectives • Need comprehensive coverage of EI • Need system-wide consistency • Need integration with greater ecosystem reporting • Need clear indicators and targets • Need effective communication of results • Need integrated data management