Download
1 / 11
110 likes | 261 Views
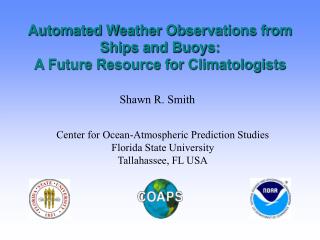
Automated Weather Observations from Ships and Buoys: A Future Resource for Climatologists. Shawn R. Smith. Center for Ocean-Atmospheric Prediction Studies Florida State University Tallahassee, FL USA. Overview. The need for in-situ climate data is not limited to land stations

E N D
Automated Weather Observations from Ships and Buoys:A Future Resource for Climatologists Shawn R. Smith Center for Ocean-Atmospheric Prediction Studies Florida State University Tallahassee, FL USA
Overview • The need for in-situ climate data is not limited to land stations • Knowledge of air-sea fluxes (e.g., heat, water, carbon) is essential for understanding global climate processes • NOAA is spearheading the U. S. effort to expand and improve the network of in-situ observations from the global oceans Image from NOAA OGP
Example: ENSO Monitoring • Prior to the 1982/83 El Niño, in-situ observations of the tropical Pacific were limited to merchant ships and island stations. • Along came TAO/TRITON • PMEL began installing and maintaining a continuous network of moored buoys • Data from these buoys improved analyses (e.g., FSU winds) used to force models • Provided a data resource to better understand ENSO as part of the climate Photo credit: NOAA/PMEL/TAO Project Office • Recently this array is transitioning from a research mode to become part of an operational observing system
Needed Observations • Ideally in-situ measurements near the ocean surface should provide all parameters needed to resolve air-sea fluxes • Meteorology: Winds, air temperature, humidity, pressure, precipitation, radiation (multiple components) • Sea surface: Temperature, salinity, sea state, ice cover • Precise platform navigation (location, orientation, earth-relative motion) • High data accuracy and sampling rates are desired • Detailed metadata are also essential (instrument heights, exposures, etc.) • Must go beyond the tropics, into harsh operational environments (e.g., Southern Ocean, North Pacific) Photo credit: USCG
Ships: The early days • For the last century, the primary source of weather data over the ocean was observations made by merchant vessel operators • Data primarily collected manually and submitted upon arrival in suitable port • GTS provided for real-time data transmission • Limitations: • Low sampling rates (3-6 hr) • Minimal navigation information • Incomplete metadata
Ships: Automation • More recently advancements in computer technology has led to the deployment of automated weather systems (AWS) • First deployed on research vessels and buoys • In the past 5 years, new initiatives have deployed sensors on volunteer observing ships (merchant ships, yachts, cruise ships) • Initial development underway for moored platforms in extreme environments Photo credit: NOAA Photo credit: WHOI Photo credit: WHOI
Typical AWS • High-resolution marine AWS • Sampling rates 1-60 minutes • Continuous recording • Typically bow or mast mounted on R/V • Data rarely available in real-time (good for independent validation) Photo credit: WHOI
Automation: future • Standard meteorological package • Fluxes are determined using a bulk modeling approach • Experimental system • Directly measure fluxes • Example: Southampton Oceanography Center AutoFlux • Hourly fluxes sent in real time Photo Credit: WHOI Photo credit: Southampton Oceanography Centre
AWS Application • Quality processed AWS data are ideal for evaluation of global reanalysis fluxes (e.g., Smith et al., 2001, J. Climate) • Sampling rates allow accurate estimation of 6 hourly integrated fluxes
AWS Application • R/V-AWS observations have also been used for validating satellite wind sensors (e.g., Bourassa et al., 2003, J. Geophys. Res.) SeaWinds on Midori Wind Direction Wind Speed
Final Thoughts • A new initiative is underway to ensure routine delivery of calibrated, quality assured, surface meteorological data collected using AWS on research vessels, volunteer observing ships, and new moored platforms. • User input is essential • Marine AWS data are a new resource for climatologists • Climatologists are asked to provide input to network design • Sampling rates, platform locations, parameters desired • Second workshop on role of marine AWS in a sustained ocean observing system is planned for 17-18 April 2004 (Silver Spring, MD) • Plan to open discussions with user community (modelers, satellite programs, etc.) • Discussion will focus on implementation plans, data user needs, and coordination between R/V, VOS, and buoy programs • Interested participants should contact (smith@coaps.fsu.edu)