Download
1 / 28
280 likes | 425 Views
Presentation Nº 1: “HYDRO LATIN AMERICA 2011” Cochabamba . July 2011. DIAGNOSTIC AND ASSESSMENT OF A URBAN watershed SEWER SYSTEM at Riereta, Sant Boi de Llobregat, SPAIN AVANCE REPORT. STUDY AREA DESCRIPTION AND LOCALIZATION.

E N D
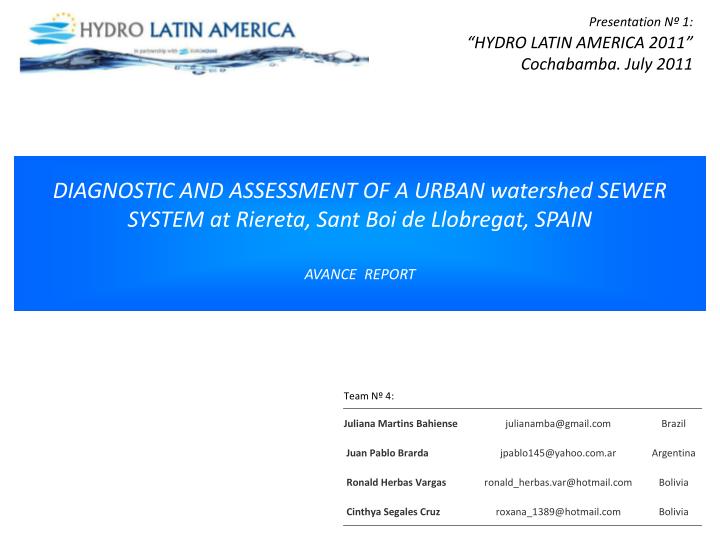
Presentation Nº 1: “HYDRO LATIN AMERICA 2011” Cochabamba. July 2011 DIAGNOSTIC AND ASSESSMENT OF A URBAN watershed SEWER SYSTEM at Riereta, Sant Boi de Llobregat, SPAIN AVANCE REPORT
STUDY AREA DESCRIPTION AND LOCALIZATION Sant Boi de Llobregat is located in the metropolitan area of Barcelona, in Barcelona province, Cataluña. It has 82,428 inhabitants (INE 2009) and it occupies an area of 22 km2. The analysis area in this study is the urban watershed of La Riereta, located at old municipality of Sant Boi de Llobregat. It has an area of approximately 15.5 ha.
STUDY AREA DESCRIPTION AND LOCALIZATION At the standpoint of urban drainage, one of the main features of the watershed is its high rate of impermeabilization which causes a significant increase on stormwater runoff. Current state of sewerage system, concerning conduits sizes and antiquity, aggravates this problems. • 1 – Increasing in volume • 2 – Flow accelaration • 3 – Runoff peak increasing
OBJETIVES General Objetive Hydrological and hydraulic behavior evaluating and diagnosing of an existing sewerage network in Riereta region, Sant Boi de Llobregat, through the use of EPA SWMM computer program. • Determine in a given year, the probability of overcapacity occurrence in the network, to a certain series of precipitation; • Determine flooding volumes in the study area for that series; • Determine peak flow rates registered during the series; • Estimate flooding permanence during this period; • Determine vulnerable areas of flooding-related phenomena in the study area; • Assess safety level in existing sewer system for a given time of recurrence (TR), identifying maximum TR which do not have surface flooding occurrence and existing network works with free surface. Particular Objetive
METHODOLOGICAL USED PROCESS Based on available information Definition of watersheds and urban sub-watersheds Topographic information of the region Existing network sewerage Urban parcelling layout • Satellite images support: • Characterization of impervious areas. • Discharge form of roofs and buildings.
METHODOLOGICAL USED PROCESS SUB-watershed: Definition of hydrological characteristics parameters LINKS: Definition of hydraulic characteristics parameters Construction of drainage topological scheme P R O C E S S Analysis of meteorological events - Construction of design rainfall. Determination of effective hyetographs to estimate runoff, regarding that runoff losses (PL) are constant. It can speed up the calibration process. Valid assumption for urban watersheds due to its fast response time. Calibration and validation of model based on available hydrological information. Chosen events were Jordi, Fidel and Martina, recorded in the watershed study. Diagnosis of drainage system considering a design rainfall with 10 years TR and duration of one hour. Fulfill the objectives for Team No. 4.
SHORT WATERSHED CHARACTERIZATION • Riereta watershed is located in the old town of Sant Boi de Llobregat, in the metropolitan area of Barcelona. • The study watershed is a urban type watershed and has an area of about 15.5 ha. • It presents high impermeabilization levels and it is completely urbanized. The houses are old. • The terrain is extremely rugged with slopes ranging between 4% and 0.5%. • Some of the distinctive characteristics of sewer system are: • Combined sewer system; • Concrete conduits with mostly circular sections and diameters ranging between 300 mm and 1200 mm; • Linking conduits through concrete inspection chambers;
SHORT WATERSHED CHARACTERIZATION Satellite image with watershed delimitation. It can be viewed the high impermeabilization rate 23 Subwatersheds 0.45 – 1.25 ha
HYDROLOGICAL PARAMETERS DETERMINATION CHARACTERISTIC WIDTH “W”: Given that real watersheds are not rectangular neither have symmetric and uniform properties, it is necessary to adopt a process that permit to estimate characteristic width to general situations. Sk = (A2 – A1) / A W = (2 – Sk) * l Sk = Correction factor; 0 ≤ Sk ≤ 1 A1 = Area at one side of drainage channel A2 = Area at other side of drainage channel A = Total area l = Lenght of main drainage channel
CALIBRATION OF MODEL DEFINITION OF AREA CALIBRATION It is not very clear definition of the urban watershed, mainly in its southeast region. We attempted a double calibration in terms of two urban watersheds. Alt. 1 Watershed 15,7 Ha. Alt. 2 Watershed Extended .
CALIBRATION OF MODEL For outstanding drivability and is expected to substantial flows occur retention flow upstream flooding back.
CALIBRATION OF MODEL Goodness of fit Goodness of fit Volume 7% 17% First Peak Flow: 10% 6% Time to Peak: 0% 1% Volume: 5% 15% First Peak Flow: 6% 3% Time to Peak: 2% 0% • Watershed set • Watershed extended
CALIBRATION OF MODEL After adjustment made in the previous two events, Martina has a particular course as it is estimated there is a relationship between the precipitate and drained over time than has been preserved in the other events. Validation N48 He tried to explain the phenomenon shaping a course siltation (Q Sealed) in the cameras record and storm drains (in the central region at the beginning of 1000 mm pipe.
CALIBRATION OF MODEL • With the quality of data provided and then adopt a calibration error, it was feasible to calibrate both watersheds. However, the alternative that best reproduces the observed watershed is adjusted, ie, Alternative 1. Conclusions • On that basis should be especially careful in the delimitation of the urban watershed and the adoption of error rates that are intended to take, especially for the volume generated for this case is advised to be less than 15%. • Note that the surplus produce flooding on the surface can rejoin the system or may drain to the south where the area is lower and thus not be incorporated into the system under study.THIS ASSUMPTION INEVITABLY WILL BE JUDGED ON THE FIELD.
DIAGNOSIS OF SEWER SYSTEM Flows will be evaluated in different sectors of the network within the watershed under study, then proceeded to evaluate the performance of the conduits, finally identified the critical areas and areas flooded by rain design. The sewer system has the form of "herringbone" where all the secondary channels are directed to a central canal of 1000 and 1200 mm diameter, which then leaves the watershed. This comes in the main conduit junction 48. 48
DIAGNOSIS OF SEWER SYSTEM NODES BEHAVIOR LINKS BEHAVIOR
DIAGNOSIS OF SEWER SYSTEM Section in Charge FloodedSections
DIAGNOSIS OF SEWER SYSTEM • The node 33 receives input from this large portion of the watershed, then flow is directed towards the 300 mm diameter pipe that has no ability to drive the flow. On that basis it is worth noting two things: • Flooding occurs in the area upstream of the conduit. • Is delayed and "crush" the outflow hydrograph downstream. This is a benefit to the downstream region as the flow is being held in the upper watershed (functions as a reservoir). Node 48 Conduction current forced Node 48 Conduction Reinforcement
DIAGNOSIS OF SEWER SYSTEM • . The responsiveness of the watershed is high, given the steep slope of some sections and the high existing imperviousnessing. Permeable areas correspond to inner courtyards and some public green spaces. Conclusiones • For the design flood of TR 10, the sewage system has serious shortcomings. The core network consists of 1000 and 1200 mm diameter for the peak flow runs on load, not enough to flood the surface. From the node 51 begins the stretch run on load until the output of the watershed. • About Node 33 major flood occurs that lasts almost all the rain. The problem occurs because the discharge flow conduit has a very limited capacity. In a short time reaches its maximum capacity. • Flooded areas correspond to the smaller pipes that channel the flow of these areas downstream. The southern region is more committed. • Given the steep slopes of the watershed, surface water drains at high speeds can cause damage not only to street furniture, but also people.
SIMULATION MODEL CONTINUES SWMM The peaks of precipitation events. For example 32% of events have an intensity of 2 mm / hr. It was necessary to determine the losses because the data provided are net precipitation. The losses were obtained according to iterate the variables that generate losses in SWMM. Thus CN was estimated rate, percentage of impervious area, among other parameters. The validation of the data was performed by comparing the results obtained by calibration with the estimates in this phase. Estimated losses once proceeded to the modeling of the watershed with annual time series. It is also estimated evaporation losses. For this purpose, had obtained records of bibliography in the region of Catalunya. The variation was chosen for modeling monthly (Monthly Averages the SWMM).
SIMULATION MODEL CONTINUES SWMM Below are events flooding the volumes associated with each. The total flood volume is 57,700 m3. A total of 8 events are identified that cause flooding in the year. The chart below shows the duration of events as a percentage. There is a 26% chance that an event lasts 1.5 h and 1% chance of 36 h.
SECURITY LEVEL EVALUATION OF SEWAGE SYSTEM A brief description of the methodology used for the purposes of assessing the level of network security to an existing sewer determined payback time, identifying maximum TR which do not occur and surface flooding in the existing network which works a free surface. Firstly, we proceeded to compute the project hail of return for different times (1, 2, 3, 4 and 5 years). After these showers, were modeled to evaluate the performance of the network. It is important to know the security level of a sewerage system when data are annual rainfall or flow of several years, at least 10 years. Thus, you can perform a continuous SWMM simulation for the purpose of evaluating the network behavior over time.
SECURITY LEVEL EVALUATION OF SEWAGE SYSTEM A brief description of the methodology used for the purposes of assessing the level of network security to an existing sewer determined payback time, identifying maximum TR which do not occur and surface flooding in the existing network which works a free surface. Firstly, we proceeded to compute the project hail of return for different times (1, 2, 3, 4 and 5 years). After these showers, were modeled to evaluate the performance of the network.
CONCLUSIONS • The area of analysis of this study is the urban watershed of La Riereta, located in the old municipality of SantBoi de Llobregat, occupying an area of approximately 15.7 hectares • From the perspective of urban drainage, one of the main features of the site is its high rate of imperviousnessingwhich causes a significant increase in stormwater runoff, the problem is compounded if one considers the current state of network sewer. • It is not very clear definition of the urban watershed, mainly in its southeast region. From this double calibration was attempted according to two urban watersheds, one hand on a watershed set (Alternative 1) and one on a watershed extended to the southeast (Alternative 2). The watershed has an area set of 15.7 ha, while the larger 17.9 ha • It was determined that the existing pipeline that links the two watersheds is 300 mm in diameter and is negatively sloped, which is expected to occur for significant volumes flow retention upstream flooding back. Thus, the peak flow will reach the node connection (node 33) will be less than generated in the watershed attached. This was represented in this study • He made a diagnosis of existing sewerage network determining that the same is very committed to certain sectors, mainly in the south. Nodes and conduits were identified entering charge, as well as the flooded regions, duration and volume. • We developed a continuous SWMM simulation for the purpose of determining the annual frequency of floods in the watershed under study. We found interesting results in relation to the timing or frequency of flooding over a year in the watershed under study It also proceeded to determine the security levels of the network from a design event. It was determined that for a recurrence less than one year, there are nodes and conduits that run under load
Presentación Nº 1: “HYDRO LATIN AMERICA 2011” Cochabamba. Julio de 2011 DIAGNOSTIC AND ASSESSMENT OF A URBAN watershed SEWER SYSTEM at Riereta, Sant Boi de Llobregat, SPAIN AVANCE REPORT