Download
1 / 34
340 likes | 441 Views
Discover how San Diego has become a clean energy champion, reaching impressive renewable energy milestones and lessons from Yolo County's innovative approach. Learn about financial strategies, city case studies, and the impact of renewable resources on local communities.

E N D
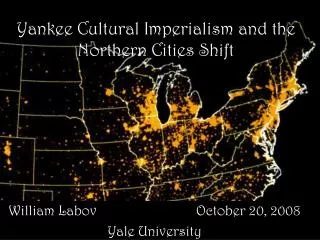
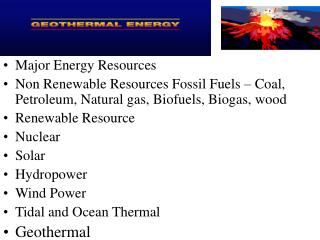
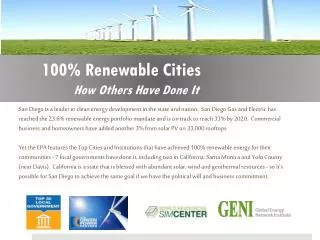
100% Renewable CitiesHow Others Have Done It San Diego is a leader in clean energy development in the state and nation. San Diego Gas and Electric has reached the 23.6% renewable energy portfolio mandate and is on track to reach 33% by 2020. Commercial business and homeowners have added another 3% from solar PV on 33,000 rooftops. Yet the EPA features the Top Cities and Institutions that have achieved 100% renewable energy for their communities - 7 local governments have done it, including two in California: Santa Monica and Yolo County (near Davis). California is a state that is blessed with abundant solar, wind and geothermal resources - so it's possible for San Diego to achieve the same goal if we have the political will and business commitment.
Cities that use 100% renewable resources to power their municipal facilities Yolo County, CA Port of Portland City of Austin, Texas City of Santa Monica, CA Forest County Potawatomi Community District of Columbia
Yolo County, California • Population: 200, 849 (0.2 million) • Relatively rural agricultural region outside its incorporated cities of Davis, West Sacramento and Woodland • GP Percentage of total use: 152% • Annual Green Power Usage: (kWh) 13,501,338 • Yolo County’s total electric usage is 3% of San Diego’s total annual usage • Green Power Resources: Solar • Provider: On-site generation • -6.8 MW installed on three sites
Summary/Site Profile 2013 Project: Outcomes
First Solar Project Implemented in 2010 "I had to look for a way to do a zero-capital investment because we didn't have any capital funding. It had to pay for itself the very first day.“ -Terry Vernon, Deputy Director of Yolo County General Services • Yolo County was facing an annual $1.4 million electric bill • Deputy director of Yolo County General Services, Terry Vernon, came up with an innovative energy solution that: • required zero capital investment • would generate revenue • zero out the County’s electric bill • Working with SunPower, Yolo County installed a 1MW ground mounted solar power system at the Yolo County Justice Campus in Woodland with no upfront capital investment • Yolo County owns the system and its associated RECs
Project Financing • Project financed through the following funding sources: • Subsidized bonds (financed by Bank of America) • Clean Renewable Energy Bonds (CREBs)-$2 Million • Qualified Energy Conservation Bonds (QECBs), available through the American Recovery and Reinvestment Act of 2009-$2 Million • California Energy Commission Loan • Secured a 15-year loan from the California Energy Commission with the assistance of SunPower Corp • $2.5 Million CEC Energy Loan • The system produced $162,000 the first year of operation
In 2013, Yolo County installed three additional solar arrays totaling 5.8 MW of power. • First Array: Woodland • Produces 0.8 MW for three buildings on the county government campus in Woodland • Ground mounted system consisting of 2,368 Panels • Does not feed power into the PG&E grid; electricity produced at the Woodland site is connected directly to the buildings electrical system through an electrical tie-in. • Net Energy Metering: The Woodland campus has seen a 75 percent reduction in its electricity bill
2nd Array: Grassland Regional Park in Davis • Two 2.5 MW arrays were installed at Grassland Regional Park in Davis and sell power back to PG&E , the local utility company, through a feed-in-tariff (FiT). • Both of these projects (Woodland site and Grassland Regional Park site) were installed with no capital investment. • In partnership with the Yolo County Office of Education, the county secured $23 million in qualified zone academy bonds (QZABs) • These projects eliminated the county’s electric bill, and earned just under $500,000 in the first year. • The county sells electricity to PG&E for 10 cents/kilowatt hour • It is predicted that these projects will generate $60 million over the next 35 years. • Production of 52% more energy than used (extra sold back to utility) • Elimination of $1.4 million annual electricity bill
Municipal Solar Financing Programs and Tariffs • Tax-Exempt Lease Purchase (TELP) • California Energy Commission 1% Energy Efficiency and Generation Loans Qualified Energy Conservation Bonds On-Bill Financing (OBF) Energy Project Lease Financing
Tariffs • Net Energy Metering (NEM) • NEM is available to all utility customers who install eligible renewable generation projects of 1MW or less. NEM allows customers to receive the full retail rate for generation that offsets energy load and may be expanded to cover excess generation through a bill credit. The credit offsets the customer’s electricity costs incurred when the system’s renewable resource is unavailable. • Bill Credit Transfer Program (AB 2466) • Allows local governments located in IOU service areas to apply excess renewable energy produced from a customer account as energy credits on another of its metered accounts. • Why this is useful: Local governments have in their portfolios properties such as closed landfills, parks, available land at wastewater treatment plants, and single-story buildings where there is a low electrical load but where cost-effective renewable energy systems can be installed. AB 2466 allows local governments to apply a bill credit to benefiting accounts at urban and multi-story buildings with high energy consumption but limited space for renewable energy system installations.
Tariffs cont. • Feed-in-Tariff (FiT) Program-Renewable Market Adjusting Tariff (ReMAT) • Through Re-MAT, SDG&E will offer power purchase agreements to distribution level renewable projects sized at 3 MWs or below from three product categories; baseload (typically including geothermal, bioenergy and hydro), peaking (typically including solar) and non-peaking (typically including wind).
Links/useful articles • http://ecowatch.com/2014/04/16/california-county-152-percent-solar/ • http://cleantechnica.com/2014/04/28/yolo-county-americas-1st-grid-positive-county/ • http://www.pv-tech.org/news/sunpower_to_install_two_solar_systems_for_yolo_county_in_california • http://www.yolocounty.org/home/showdocument?id=20514 • http://www.nrel.gov/docs/fy11osti/49450.pdf
Municipal Solar Financing Programs and Tariffs • Tax-Exempt Lease Purchase (TELP) • TELPs allow a public sector organization to borrow large sums of money from the capital markets to finance major capital projects without having to issue municipal bonds. When properly structured, this type of financing mechanism allows public sector agencies to draw on dollars saved from future utility bills to pay for new, energy-efficient equipment today • California Energy Commission 1% Energy Efficiency and Generation Loans (CEC) • Over $22 million in loan funds from the Energy Commission are available for cost-saving energy projects. The Energy Conservation Assistance Account (ECAA) offers 1% interest rate loans for public entities in California installing eligible projects including energy efficiency and renewable technologies.
City of Santa Monica • Population: 88,000 • Relatively small city • GP percentage of total • use: 100% • Annual Green Power Usage: • (kWh) 25,900,000 (approx. 10% of San Diego’s annual total electricity usage) • *City of San Diego uses 254,310,312.5 (kWh) of electricity annually to power their municipal facilities • Green Power Resources: solar, wind • Provider: Commerce Energy
Santa Monica-the first city to power all their facilities with 100% green energy • The City of Santa Monica made history June 1, 1999, as green electricity began powering all municipal facilities -including the Santa Monica Airport, City Hall and the Santa Monica Pier - making it the first city in the world to switch to 100% renewable resources to meet the power needs of city facilities. Under the contract, the city purchases approximately 5MW of renewables. The proposed purchase is equivalent to the amount of electricity used by 5,000 to 6,000 homes.
RECs • Santa Monica and Commerce Energy entered into an agreement to purchase 100 percent renewable energy in the form of renewable energy certificates (RECs) for city electrical accounts. • A direct access customer since 2001, the city pays Commerce Energy approximately $2 million per year for the electricity commodity and Southern California Edison approximately $2.5 million per year for transmission and distribution through the electric grid. • The city purchases a “bundled” product of electricity and renewable energy certificates (RECs) that allows the city to achieve its 100 percent renewable energy goals.
links • http://www.smmirror.com/articles/News/Santa-Monica-City-Hall-Purchases-Renewable-Electricity/35724
City of Austin, Texas Population: 800,000 (0.8 Million) GP percentage of total use:100% Annual Green Power Usage (kWh) 296,073,169 (116% of SD annual energy usage) Green power resources: Wind Provider: Austin Energy Largest city in the US to use 100% renewable resources
Achieved 100% renewable through purchase of RECs • In October 2011, the municipality enrolled all of its electric accounts to the Green Choice program offered through Austin Energy, the public owned utility. • The renewable energy is produced at wind farms in west Texas and purchased from Austin energy. • The local government powers all of its facilities with 100% green energy.
Costs • The renewable energy is approximately 5.7 cents per kilowatt-hour, and 2.5 cents more than the standard charge for residential customers. • Austin will be locked into the green rate for 10 years • Benefits: these subscriptions provide stability in electric costs for the city of Austin operations and also take a leadership step forward in climate responsibility • Shifting to green power (wind) will add $8.5 million in costs to the city this year. Officials estimate that the cost difference will shrink to just $3 million per year by 2021 as the prices of oil and natural gas rise.
Decision to move to a 100% renewable portfolio • Moving to a renewable portfolio was partially spurred by a decision made in late 2008, when Austin’s city-owned utility agreed to purchase power from a west Texas wind farm. The city, in turn, had hoped to convince Austinites to buy that wind power as part of its GreenChoice program. But persuading customers to make the switch has proven more difficult than the city anticipated: It has only been able to sell about 25 percent of the wind energy to customers. Now, the city will essentially make up the difference by simply buying that wind power for itself. • Cons: Purchasing RECs doesn’t generate revenue for the city, and it increases the budget deficit/reduces budget surplus.
LINKS • http://www.governing.com/topics/energy-env/austin-goes-100-percent-renewable.html • http://www.govtech.com/technology/Austin-Texas-Switches-to-All-Renewable-Energy.html • http://www.sustainablecitynetwork.com/topic_channels/energy/article_4b001bd2-ef04-11e0-ab44-0019bb30f31a.html • http://www.irena.org/Publications/RE_Policy_Cities_CaseStudies/IRENA%20cities%20case%204%20Austin.pdf
District of Columbia • Population: 632,323 (0.6 million) • GP percentage of total use: 100% • Annual green power usage (kWh) 534,084,977 (2x San Diego’s annual energy use • Green power resources: wind • Provider: Washington Gas energy services
Achieved 100% renewable through purchase of RECs • The District of Columbia Department of General Services signed a one-year contract in 2013 for 100 percent wind power from WGES CleanStepsWindPower program. • Prior to this, DC was using 50% renewable energy. • The electricity is generated from WGES’ wind farm in Northern Virginia
Paper: Wind Power for Washington D.C. Government: an Appraisal of Options • Paper commissioned by the Government of Washington, D.C.’s District Department of the Environment (DDOE) • Published in April 2011 • Identifies ways for the DC government to acquire the wind power for its own facilities in a way that allows it to come out financially-that is, to pay less for wind power than it now pays for conventional electricity. • The report seeks to determine whether it makes financial sense for the District to add direct-generation wind energy to its electricity portfolio, and how it would go about doing so. • The report asks the question: Does it make economic sense for the DC government to take an ownership position in a wind farm and then supply its own facilities with the electricity at a lower price than it now pays for electricity? The short answer to this question is yes.
RECs versus on-site generation • RECs are not economically beneficial for the government because • They are purchased separate from electricity are and bought at a premium above and beyond what the government pays for electricity. • They don’t provide the government protection from rising conventional electricity prices. Even if the government were to purchase wind RECs equivalent to 100 percent of its electricity consumption, higher coal or natural gas prices would still result in electricity bill increases.
Links • http://www.wges.com/page/press_detail.php?p=62 • http://sustainable.dc.gov/release/dc-government-increases-proportion-green-electricity-100-percent-purchases-wins-epa-award • http://inhabitat.com/dcs-government-agencies-to-be-100-percent-powered-by-wind-energy/wind-power-dc-government-2/ • http://www.sustainablecommunityinitiatives.org/html/DCWINDPOWER.pdf
Port of Portland, Oregon • The Port of Portland was one of the "Top Local Governments" Portland is currently generating nearly 14 million kWh of clean renewable power through on-site solar, biogas, micro wind and micro hydro resources • Annual Green Power Usage (kWh): 75,070,343 • Green Power percentage of total use: 103% • Provider: NextEra Energy Resources, on-site generation
Port of Portland • http://www.portofportland.com/publications/PortCurrents/?tag=/solar+panels • http://www.aesrenew.com/aboutsolar/content/doc/67 • http://www.getf.org/wp-content/uploads/2011/06/2013-Update-Environmental-Initiatives-Worldwide-UPDATE-August-2013-Final-II.pdf • http://www.politico.com/story/2013/06/cape-wind-project-energy-offshore-93255.html • https://www.pacificpower.net/env/bsre/cpf.html