Download
1 / 1
10 likes | 83 Views
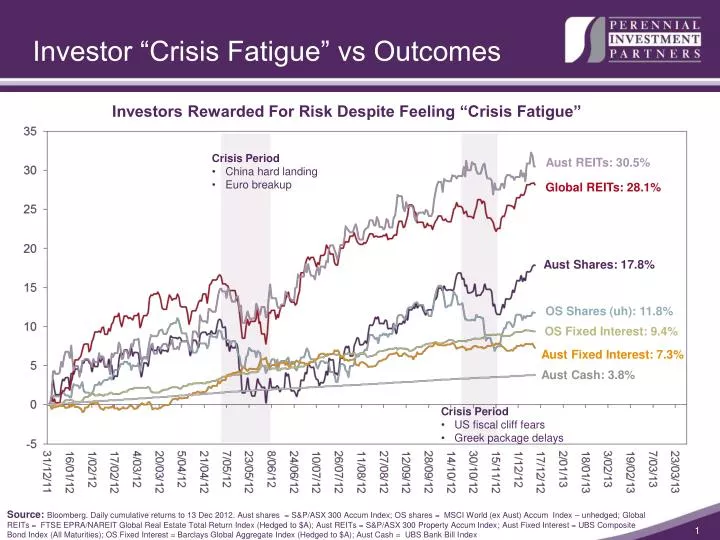
Investor “Crisis Fatigue” vs Outcomes. Investors Rewarded For Risk Despite Feeling “Crisis Fatigue”. Crisis Period China hard landing Euro breakup. Aust REITs: 30.5%. Global REITs: 28.1%. Aust Shares: 17.8%. OS Shares (uh): 11.8%. OS Fixed Interest: 9.4%. Aust Fixed Interest: 7.3%.

E N D
Investor “Crisis Fatigue” vs Outcomes Investors Rewarded For Risk Despite Feeling “Crisis Fatigue” • Crisis Period • China hard landing • Euro breakup Aust REITs: 30.5% Global REITs: 28.1% Aust Shares: 17.8% OS Shares (uh): 11.8% OS Fixed Interest: 9.4% Aust Fixed Interest: 7.3% Aust Cash: 3.8% • Crisis Period • US fiscal cliff fears • Greek package delays Source: Bloomberg. Daily cumulative returns to 13 Dec 2012. Aust shares = S&P/ASX 300 Accum Index; OS shares = MSCI World (ex Aust) Accum Index – unhedged; Global REITs = FTSE EPRA/NAREIT Global Real Estate Total Return Index (Hedged to $A); Aust REITs = S&P/ASX 300 Property Accum Index; Aust Fixed Interest = UBS Composite Bond Index (All Maturities); OS Fixed Interest = Barclays Global Aggregate Index (Hedged to $A); Aust Cash = UBS Bank Bill Index