Download
1 / 12
130 likes | 285 Views
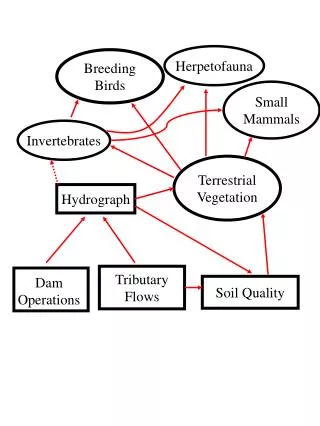
Stream flow hydrograph separation using end member mixing analysis on streams throughout the USA. Tonia Hack William Sanford Department of Geosciences Colorado State University. Approach. Separate hydrograph using 2-component end member mixing Estimate baseflow

E N D
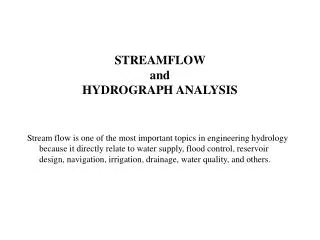
Stream flow hydrograph separation using end member mixing analysis on streams throughout the USA Tonia Hack William Sanford Department of Geosciences Colorado State University
Approach • Separate hydrograph using 2-component end member mixing • Estimate baseflow • Compare to analytical methods: fixed interval, sliding interval, local minimum • Apply to various US streams
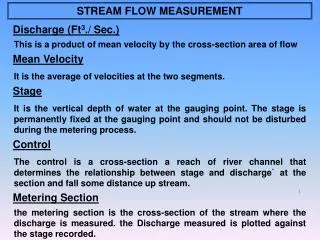
Hydrograph Separation • 2-component hydrograph separation • Analytical methods use constant time base of direct runoff from event to event (Linsleyet al., 1982) N = 0.8A0.2 • N is time in days after peak discharge that all discharge is considered baseflow • A is watershed area in km2 • Analytical methods use 2N* moving time window • Odd integer between 3-11 closest to 2N e.g.A=112km2 N=0.8(1120.2)=2.06 2N=2(2.06)=4.12 2N*=5
Analytical Methods(Pettyjohn and Henning, 1979; Sloto and Crouse, 1996) Sliding Interval Fixed Interval Local Minimum
Conductivity Mass Balance (CMB) Method(Stewart et al., 2007) • BF is daily baseflow • Q is daily discharge • QCis daily conductance • ROC is runoff conductance • BFC is baseflow conductance • Method chosen due to availability of USGS discharge and specific conductance data
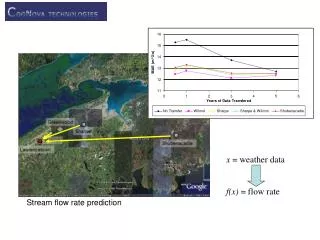
Study Sites Groundwater regions from Thomas (1952)
Summary • 2 component CMB shown to estimate baseflow • Snowmelt signal affects analytical method baseflow • CMB estimates lower cumulative baseflow compared to analytical methods • Next steps include: • Calculation of baseflow during periods of non-snowmelt • Calibrate analytical method baseflow to CMB baseflow