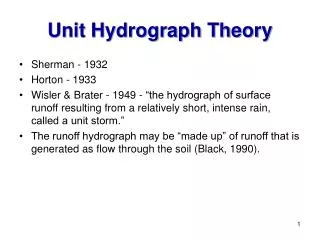
Hydrograph Separation Study
Hydrograph Separation Study. Jesse Bradley Nebraska Department of Natural Resources May 18, 2009. Introduction. Pilot study to assess some of the available methods for hydrograph separation Assess how basin characteristics (size, hydrogeology, regulation) influence method results

Hydrograph Separation Study
E N D
Presentation Transcript
Hydrograph Separation Study Jesse Bradley Nebraska Department of Natural Resources May 18, 2009
Introduction • Pilot study to assess some of the available methods for hydrograph separation • Assess how basin characteristics (size, hydrogeology, regulation) influence method results • Develop repeatable methods for use in evaluating streamflow characteristics across Nebraska
Outline • Review hydrograph separation methods evaluated for use in the pilot study • Discuss modifications required for regulated streams when using the automated hydrograph separation techniques • Review results and discuss limitations
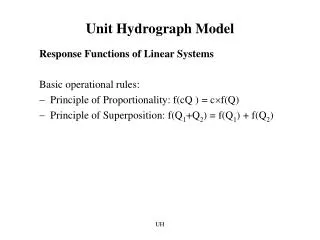
Why Use Hydrograph Separation Techniques? • Hydrograph separated base flow/residual estimates are valuable for a variety of purposes • Estimating groundwater discharge/recharge • Estimating flooding potential • Model calibration • Assess impacts of water development • Determine basin scale estimates of base flow and quick flow (residual) • Base flow includes: groundwater discharge and discharge from other delayed sources • Residual includes: overland flow and subsurface flow (through flow and interflow)
Hydrograph Separation Rising Limb Falling Limb Base Flow
MethodsEvaluation of Hydrograph Separation Techniques • Pilot Point Method • United States Bureau of Reclamation base flow Index program (USBRBFI) • Purdue University Web-based Hydrograph Analysis Tool (WHAT) • One Parameter Filter • Recursive Filter • USGS PART program
MethodsPilot Point Method • Spreadsheet based manual approach that analyzes flow at predetermined intervals • User defines perceived contribution of base flow on that day • Linear interpolation is used to estimate base flow for days in between defined flow
MethodsUSBRBFI • Combines a local minimums approach with a recession slope test • The program identifies days which are turning points and draws a straight line between points on a semilogarithmic plot • The program has been found to be consistent and indicative of long term base-flow trends • Daily output available
MethodsUSBRBFI • Tuning of the program accomplished by varying the N (number of days) and f (turning point test factor) • N has most significant effect (inverse relationship to base flow estimate) • f can be modified however the authors of the program recommend 0.9 for use
MethodsUSBRBFI Method • Appropriate N determined by the point at which the slope changes
MethodsUSBRBFI Method • Effect of modifying the f parameter
MethodsWHAT • Digital Filtering methods have been used in signal analysis and processing to separate high frequency signal from low frequency signal (Lyne and Hollick,1979). • The method has been used in base flow separation because high frequency waves can be associated with the direct runoff (residual), and low frequency waves can be associated with the base flow (Eckhardt, 2004). • Others have compared digital filter results with manual separation results. Annual filtered base flow results were within 11 percent of base flow estimated from manual separation (Arnold et al., 1995).
MethodsWHAT • Two digital filters available • One parameter filter • Value of 0.925 for alpha recommended (Nathan and McMahon, 1990) • Recursive digital filter • Value of 0.98 for alpha and basin dependent BFI max (Ekhardt, 2004) • 0.8 for perennial streams with porous aquifers • 0.5 for ephemeral streams with porous aquifers • 0.25 for perennial streams with hard rock aquifers • Digital filters are not physically based but have been proven to provide reliable results
MethodsUSGS PART • The method designates base flow to be equal to streamflow on days that fit a requirement of antecedent recession (length greater than N and rate less than 0.1 log cycles per day), linearly interpolates base flow for other days • Data input requires drainage area above the gage (N = A0.2) • Data output in units of specific discharge (inches/time) • Output available in daily, monthly, quarterly, and annual output • Method results become less dependable with increased basin size
MethodsUSGS PART • Linsley and others (1982) suggest that PART should not be applied for basins that are larger than 2,000 square miles and that the upper limit may be much smaller where convective rainfall predominates. • The Part program author recommends that 500 square miles be used as an upper bound
ResultsMethod Comparison Drainage Area: 1,500 sq miles Average BFI: 0.86
ResultsMethod Comparison Drainage Area: 984 sq miles Average BFI: 0.65
ResultsMethod Comparison Drainage Area: 940 sq miles Average BFI: 0.93
Regulated Stream Systems • Automated hydrograph separation techniques developed for use in basins without alteration of the flow system • Many of Nebraska’s streams have been altered • Storage reservoirs • Canal diversions • Must account for diversion and storage release in daily flow record • Evaluate gages by “reach gain”
Assumed One day travel time Upstream Gage (UG) = G1date + Rdate+1 Downstream Gage (DG) = G2date+1 + CD2date + CD1date-1 Base flow Gain/Loss = DG - UG Accounting for Storage Releases, Canals, and Tributaries Canal diversion #1 (CD1) Gage #2 (G2) Gage #1 (G1) Return (R) Canal diversion #2 (CD2)
Summary • All methods were able to produce similar results in most basins • When using PART must be cautious of results for basins larger than 500 square miles in size • When using the WHAT Recursive Filter estimates of long-term base flow will be greatly impacted by BFI max • When using methods on streams impacted by storage releases and/or canal diversions must redevelop daily flow record • Filter methods may overestimate base flow for streams impacted by extended periods of runoff
Summary • The PILOT Method typically provided the lowest estimate of baseflow (exceptions may apply especially in regulated streams) • Users should be very cautious about using automated methods for short-term storm events (annual estimates are more reliable) • Any results need to be reviewed for their use in a specific application • The WHAT (one parameter) method was the preferred method for consistency and efficiency in data processing • The WHAT (one parameter) method is capable of providing reach estimates of base flow in regulated streams when storage and canal data are considered • Regulated streams may require additional information prior to utilization in groundwater modeling efforts (ungaged tribs, ungaged returns, etc)