Download
1 / 2
20 likes | 142 Views
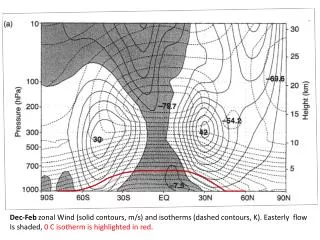
This analysis presents zonal wind patterns and isothermic contours for December-February and June-August periods. Solid contours depict wind speed in meters per second (m/s), while dashed contours represent temperature isotherms in Kelvin (K). The easterly flow is highlighted, and the 0°C isotherm is marked in red. This comprehensive study aims to enhance understanding of seasonal wind dynamics and temperature variations, which are crucial for meteorological assessments and climate studies.

E N D
Dec-Feb zonal Wind (solid contours, m/s) and isotherms (dashed contours, K). Easterly flow Is shaded, 0 C isotherm is highlighted in red.
June- Aug zonal Wind (solid contours, m/s) and isotherms (dashed contours, K). Easterly flow Is shaded, 0 C isotherm is highlighted in red.