Download
1 / 21
210 likes | 320 Views
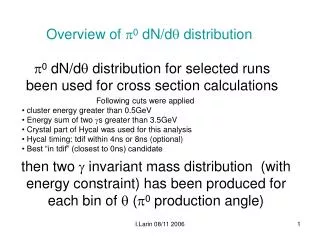
Overview of p 0 dN/d q distribution. p 0 dN/d q distribution for selected runs been used for cross section calculations. Following cuts were applied cluster energy greater than 0.5GeV Energy sum of two g s greater than 3.5GeV Crystal part of Hycal was used for this analysis

E N D
Overview of p0 dN/dq distribution p0 dN/dq distribution for selected runsbeen used for cross section calculations Following cuts were applied cluster energy greater than 0.5GeV Energy sum of two gs greater than 3.5GeV Crystal part of Hycal was used for this analysis Hycal timing: tdif within 4ns or 8ns (optional) Best “in tdif” (closest to 0ns) candidate then two g invariant mass distribution (with energy constraint) has been produced for each bin of q (p0 production angle) I.Larin 08/11 2006
p0 dN/dq distribution for selected runs, PWO-only Each bin of the distribution is a result of mass distribution fit I.Larin 08/11 2006
Two g invariant mass plots with the double gaussian fit; dN/dq for bins for q = 0…0.16 degrees I.Larin 08/11 2006
Two g invariant mass plots with the double gaussian fit; dN/dq for bins for q = 1.12…1.28 degrees I.Larin 08/11 2006
Two g invariant mass plots with the double gaussian fit; dN/dq for bins for q = 2.4…2.56 degrees I.Larin 08/11 2006
Two g invariant mass plot with the double gaussian fit; dN/dq for all q bins I.Larin 08/11 2006
No systematic shift between number of signal events in the total distribution and sum of partial (dN/dq) mass distributions within statistical error of ~1% I.Larin 08/11 2006
p0 invariant mass spectrum without and with energy constraint Contribution of selected bands I.Larin 08/11 2006
Elasticity distribution with p0 mass constraint for events with no Hycal trigger bit-9 presented and for all events I.Larin 08/11 2006
No artificial structure under the elasticity peak resulting from mass constraint method is seen I.Larin 08/11 2006
p0 tdif distribution Each bin of the distribution is a result of mass distribution fit I.Larin 08/11 2006
Two g invariant mass plot with the double gaussian fit; dN/dq for all q bins | tdif | < 8ns cut Difference between distributions with | tdif | < 8ns and | tdif | < 4ns cuts I.Larin 08/11 2006
p0 dN/dq distribution, comparing timing cuts Two plots for | tdif | < 8ns and | tdif | < 4ns cuts Primakoff q region is selected I.Larin 08/11 2006
Difference between two results obtained with 4ns and 8ns timing cut is 0.8% which is also within statistical error level I.Larin 08/11 2006
Studying tagging ratio fluctuations during the first snake scan • First, events with Tagger hit in one of 11 production T-counters were selected • Hycal scan periods close to edges or central hole were excluded from the analysis as well as beam trips • Then Hycal energy deposition was required to distinguish “false” and “real” Tagger candidates • Three sets of “enough energy” in Hycal were selected: 20%, 40% and 60% of nominal beam energy (given by Tagger) I.Larin 08/11 2006
Hycal energy response: ratio of Hycal energy to Beam energy defined by Tagger I.Larin 08/11 2006
Tagging ratio (integrated over all 11 T-counters) defined with 3 values of Hycal energy cut VS snake scan time I.Larin 08/11 2006
Tagging ratio (integrated over all 11 T-counters) fluctuations during the first snake One entry per one time interval I.Larin 08/11 2006
Tagging ratio for 1 and 2 T-counters, fluctuations during the first snake I.Larin 08/11 2006
Tagging ratio for all E-channels, defined with Hycal, integrated over all first snake time I.Larin 08/11 2006
Tagging ratio fluctuations during the first snake scan period were within 0.9% Since Hycal was used in this study some fluctuations may come from Hycal response function difference for different Hycal parts I.Larin 08/11 2006