Download
1 / 25
260 likes | 434 Views
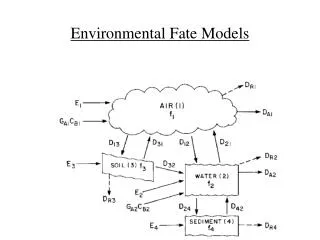
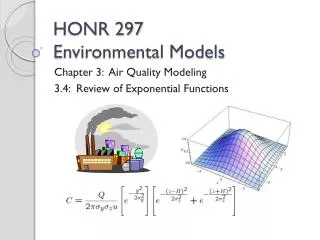
HONR 297 Environmental Models. Chapter 3: Air Quality Modeling 3.4: Review of Exponential Functions. Functions. What is a function? Here is an informal definition: A function is a procedure for assigning a unique output to any acceptable input .

E N D
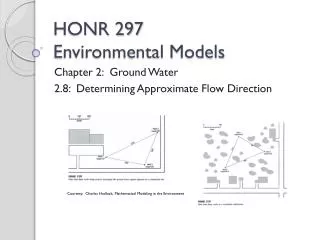
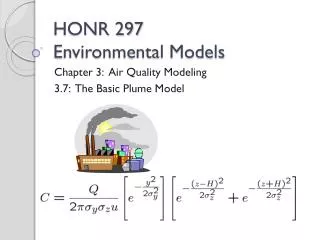
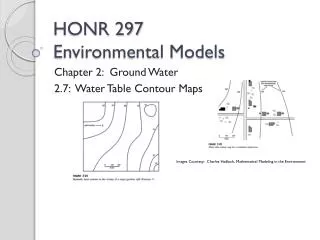
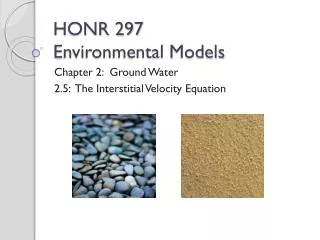
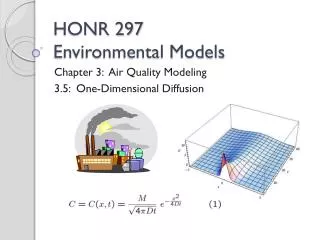
HONR 297Environmental Models Chapter 3: Air Quality Modeling 3.4: Review of Exponential Functions
Functions • What is a function? • Here is an informal definition: • A function is a procedure for assigning a unique output to any acceptable input. • A function’s domain is the set of allowable inputs. • A function’s range is the set of outputs one gets by putting in all domain values. • Functions can be described in many ways!
Example 1 (Some Functions) • (a) Explicit algebraic formula • f(x) = 4x-5 (linear function) • g(x) = x2 (quadratic function) • r(x) = (x2+5x+6)/(x+2) (rational function) • p(x) = ex (exponential function) • Functions f and g given above are also called polynomials.
Example 1 (Some Functions) • (b) Graphical representation, such as the following graph for the function y = x3+x.
Example 1 (Some Functions) • (c) Description or procedure • Assign to each house or business in a neighborhood a street address. • Assign to each house or business in a neighborhood an air quality level. • Record the number of NPL sites in each state. • Measure the head level in each monitoring well at a gas station with leaking storage tanks. • Etc.
Example 1 (Some Functions) • (d) Table of values or data • The table to the right shows the land area in Australia colonized by the American marine toad (Bufomarinis).
Example 1 (Some Functions) • Question: What are the domain and range of each example given above?
Functions with More Than One Input • All of the examples of functions given above are single variable functions, i.e. for each single input, the function produces an output. • A function may also have more than a single input value – we call this type of function a multi-variable function. • The ideas of domain and range can be extended to multi-variable functions!
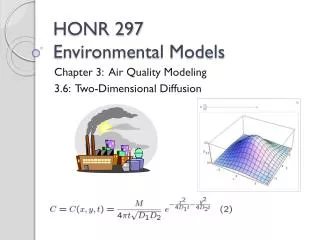
Example 2 (Some Multi-Variable Functions) • The function z = x2 + 3y2 is a multi-variable function. • For each choice of an x and y value, which we can denote as an ordered pair, (x, y), this function produces an output z. • If (x, y) = (-1, 4), then • z = (-1)2 + 3(4)2 = 1 + 3(16) = 49 • We can graph this function – to do so we need three coordinate axes! • Other examples of multi-variable functions include z = sin(x)*cos(y) and the contaminant plume model we saw in our last lecture!
Exponential Functions • An exponential function is a function of the form • y = ax for a > 0. • We call a the base of the exponential function. • For exponential functions, the input is the power to which the base a is raised! • All exponential functions with base a ≠ 1 have the following in common: • Domain: all real numbers x • Range: all real numbers y > 0 • (0,1) is on the function’s graph • The graph is either always increasing or always decreasing!
Example 3 (Some Exponential Functions) • f(x) = 2x • g(x) = (1/2)x = 2-x by Laws of Exponents! • h(x) = ex
Exponential Functions in Models • It turns out that exponential functions are very useful as models in many settings. • For example, exponential functions can be used to describe population growth, radioactive decay, investment interest, cooling of coffee, and air pollution!
The Base e • Any real number a > 0 can be used as a base in an exponential function. • It turns out that a base that is very convenient to work with is Euler’s number, e = 2.71828 … • This number, which like pi is irrational (i.e. it cannot be written in terminating or repeating decimal form). • One reason e is chosen as a base is that the graph of y = ex has a slope of one at the point (0,1).
The Base e • Another reason for choosing the base of e is that the inverse of the this function is y = ln x and it is easier to work with ln x than it is to work with logarithms in other bases. • Finally, any exponential function with base a is related to an exponential function with base e via ax = exlna.
The Base e – Some Notes! • Notation and terminology: • exp(x) = ex • We call exp(x) the natural exponential function. • We call ln x the natural logarithm function. • The reason for this is that the natural exponential function appears in many models of things found in nature (such as those listed above on slide 14). • Euler probably chose e for “exponential”, since e is used as the base of an exponential function …
The Base e – Some ways to define (and estimate) it! • e is the limit as x approaches infinity of (1+1/x)^x. • This means that as x gets larger and larger, (1+1/x)^x gets closer and closer to the number e. • e = 1 + 1/1! + 1/2! + 1/3! + 1/4! + 1/5! + … • Here’s another way to define e in terms of an area: • http://www.youtube.com/watch?v=UwMhx8JcSJQ
A Better Trendline for the Toads Data • Using Excel’s Trendline feature, we can find a function that fits the data better than a linear function! • It turns out that an exponential function does a much better job!
Example 4 • Using the exponential trendline found by Excel, along with the POWER and EXP function, compare the actual toad data to that found with the exponential trendline • y = 9*10-62e0.0779x. • Note that Excel 2007 may give • y = 9*10-62e0.077x.
Example 4 • A way to fix the “missing digits” in the trendline equation can be found here: http://support.microsoft.com/kb/282135 • Unfortunately, this may introduce a new problem!
Scientific Notation • In the exponential function found by Excel to model the toad data, the coefficient of the exponential term was given as 9E-62. • This number is to be interpreted as 9*10^(-62), which is in scientific notation. • Recall that multiplying a number by an integer power of 10 moves the decimal place right if the power is positive and left if the power is negative. • Scientific notation is useful for working with very large numbers or numbers very close to zero.
Example 5 • Write each number using scientific notation • - 45,000,000,000,000,000 = - 4.5 x 10^(16) • 0.0000000000000124579 = 1.24579 x 10^(-14) • Write each number given in scientific notation as a decimal • - 2.345 x 10^(-7) = - 0.0000002345 • 3.56 x 10^(72) = 356000000000 … 000 (70 zeros!)
Exercises • Using a graphing calculator or Excel, try to sketch the functions given in problems # 1 – 5 on page 79 of Hadlock. • Repeat with Mathematica, Wolfram Alpha, or some other online graphing package.
Resources • Charles Hadlock, Mathematical Modeling in the Environment – Chapter 3, Section 4 • James Stewart, Calculus – Early Transcendentals (7th. ed.) • St. Andrews History of Mathematics Archive (Euler’s picture) • http://www-groups.dcs.st-and.ac.uk/~history/PictDisplay/Euler.html