Download

1 / 16
160 likes | 418 Views
Waiting Lines. Students should be able to: Categorize a waiting line problem as to customer population, waiting line arrangement, and service facility arrangement. Describe the operating characteristics of waiting line systems and the important decisions.

E N D
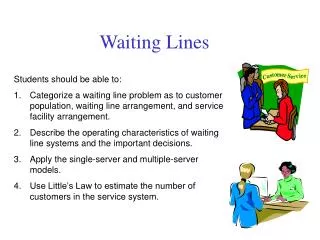
Waiting Lines • Students should be able to: • Categorize a waiting line problem as to customer population, waiting line arrangement, and service facility arrangement. • Describe the operating characteristics of waiting line systems and the important decisions. • Apply the single-server and multiple-server models. • Use Little’s Law to estimate the number of customers in the service system.
Customer population Service system Waiting line Served customers Service facilities Priority rule Figure C.1 Waiting Line Models
Service facilities (a) Single line Service facilities (b) Multiple lines Waiting Line Arrangements Figure C.2
Operating Characteristics • Line length • Number of customers in system • Waiting time in line • Total time in system • Service facility utilization
Decision Areas • Arrival rates • Number of service facilities • Number of phases • Number of servers per facility • Server efficiency • Priority rule • Service facility arrangement
Waiting Line Assumptions • Customer population : Infinite and patient • Customer arrivals : Poisson distribution • Mean arrival rate = l • 3. Service times : Exponential distribution • Mean service rate = m • Priority rule : First-come-first-served (FCFS) • Waiting line : Unlimited length
Service facility Service Facility Arrangements Single channel, Single phase
30 35 Single-Server Model Single-Channel, Single-Phase System Arrival rate = 30/hour Service rate = 35/hour l m Utilization = = = = 0.857, or 85.7% m - l 30 35 – 30 l Average number in system = L = = = 6 customers Average number in line = Lq = L = 0.857(6) = 5.14 customers 1 m - l 1 35 – 30 Average time in system = W = = = 0.20 hour Average time in line = Wq= W = 0.857(0.20) = 0.17 hour Example C.3
Service facility 1 Service facility 2 Service Facility Arrangements Multiple channel, Single phase
Multiple-Server Model Multiple-Channel, Single-Phase System Distribution Center s = 4 unloading bays λ = 3 trucks arrive per hour μ = 1 truck unloaded per hour per bay Suppose that it was observed that the average number of trucks waiting to be unloaded is 1.528 trucks. hours waiting hours being unloaded and waiting trucks in the system utilization
Designing a Distribution Center Proposed design: 4 unloading bays Employees required: 2 per bay -- $30 per hour each Truck arrivals: 3 per hour Unloading rate: 1 truck per hour per team Idle truck cost: $100 per hour Number Number of Employee Number of Truck of BaysEmployeesCost/HrTrucks in SystemCost/HrTotal 4 8 $240 4.53 $453 $693 5 10 $300 3.35 335 635 6 12 $360 3.10 310 670 7 14 $420 3.03 303 723 5 Bays are the least expensive to operate.
Choosing a Service Facility Arrangement • Suppose you have two servers, each can service 5 customers per hour. • In Design 1, which is two single-line, single-server facilities, each server has her own line and each receives and average of 4 customers per hour. • In Design 2, which is a single-line, multiple-server facility, there are two servers and an average demand of 8 customers per hour. How do the designs affect customer service?
How Does Facility Arrangement Affect Customer Service? Design 1 Design 2 Utilization Number in System Number in Line Wait Time in System Wait Time in Line
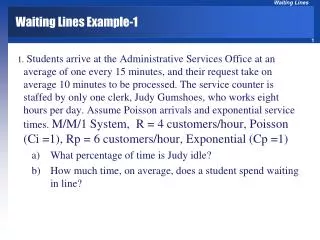
NYPD Patrol System • Data • The average service time is 30 minutes. • Precinct statistics • Precinct Average Calls Total Felonies Size • per Hour per Year Sq. Miles • ________ ___________ ___________ _______ • A 6.4 10,600 1.9 • B 3.8 6,600 .8 • If you had a total of 9 cars to allocate, how would you do it?
Precinct Waiting Statistics Precinct A # Cars Utilization 4 5 6 7 8 .373 .080 .023 .007 .002 2.390 .513 .145 . 043 . 012 .800 .640 .533 .457 .400 Precinct B # Cars Utilization 2 3 4 5 6