Download
1 / 36
360 likes | 590 Views
Multidimensional Analysis of Atypical Events in Cyber-Physical Data. Lu-An Tang , Xiao Yu, Sangkyum Kim, Jiawei Han, Wen-Chih Peng, Yizhou Sun. Outline. Introduction Backgrounds Model Construction Query Processing Experiments. Introduction.

E N D
Multidimensional Analysis of Atypical Events in Cyber-Physical Data Lu-An Tang, Xiao Yu, Sangkyum Kim, Jiawei Han, Wen-Chih Peng, Yizhou Sun
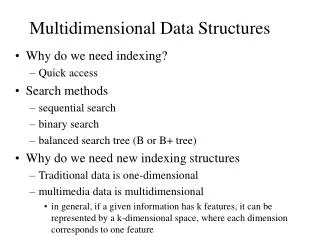
Outline • Introduction • Backgrounds • Model Construction • Query Processing • Experiments
Introduction • Cyber Physical System: Integrate physical devices (e.g., sensors, cameras) with cyber components to form a situation aware analytical system • Many promising applications • traffic observation • intruder/motion detection • battlefield surveillance • remote healthcare • Key task: Analyze the atypical data with multi-dimensionalinformation
Motivation Example I • Taffic Monitoring System: Typical CPS • Inductive loop sensors • Thousands, placed every few miles in highways • 24 hours * 7 days • monitoring traffic and report congestions
Motivation Example II • Questions from Transportation Officers • When do the congestion usually happen in downtown? • Where do the congestion happen in the weekday? • In the past three months, which road is the most seriously congested, how do those congestion start? • Traditional SQL query cannot satisfy them
Our Contribution • They demand the results that are summarized, self-organized and succinct, be delivered inshort time • Our goal • Construct a data model for atypical data in CPS • Support efficient query processing with such model
Challenges • Massive Data • Thousands of sensors generate giga-bytes, even tera-bytes of data • Complex Event • The atypical event is a dynamic process influencing multiple spatial regions • How to represent such an event? – new measure/model • Effectiveness & Efficiency • If the query range is large, many events are involved • Retrieve the significant ones in short time – new algorithm
Our Contribution • Introduce the techniques to discover atypical events and summarize them as atypical micro-clusters • Integrate the similar micro-clusters to macro-clusters to generate big figure • Construct the data model of atypical cluster forest • Using a guiding algorithm to retrieve the significant cluster efficiently
Outline • Introduction • Backgrounds • Model Construction • Query Processing • Experiments
CPS Systems in Traffic Application • PeMS: collects data in California highway • CarWeb: collects real time GPS data from cars • Google Traffic: Toolkit on Google Map • CubeView by Shekhar et.al: Implement traditional OLAP on the traffic data • AITVS: based on CubeView, using two more distinct views to support investigation • Most focus on SQL based queries, lacking analysis power • Build on the whole dataset – huge I/O overhead, atypical data are dwarfed
Other Spatial OLAP Techniques • Spatial Cube by Stefanovic et. al: dimension members are spatially referenced and can be represented on a Map • Trajectory Cube by Giannotti et. al: include temporal, spatial, demo-graphic and techno-graphic dimensions, two kinds of measures: spatial measure and numerical measure • Flow Cube by Gonzalez et. al: analyzing item flows in RFID applications • Different object – cannot use them directly in this problem
Preliminaries • Atypical record: (s, t, f(s,t)) • s: sensor • t: reported time • f(s,t): severity measure • Analytical query Q(W, T, etc) • W: spatial region • T: time period • There might be query conditions on other dimensions • Return total severity: • Too abstract
Problem Formulation • Let R be the CPS dataset, retrieving the atypical events from R, designing a measure to represent the event and integrating the information of multiple events • Process analytical query Q in online time • We assume the atypical criteria is given and the atypical dataset can be acquired in advance
Outline • Introduction • Backgrounds • Model Construction • Query Processing • Experiments
Atypical Event • Let us examine the atypical event -- congestion in traffic monitoring system : • start from a single segment of the streets • expand along the road and influence nearby roads • may cover hundred road segments when reaching the full size • The data records in a congestion are spatially close andtimely relevant
Retrieve the Atypical Event • Scan the dataset, retrieve the atypical records and group them by a time threshold and distance threshold • The atypical event is a set of atypical records • The size is not bounded (or bounded by the size of dataset R) • Difficult to represent and integrate • Too detail -- not a good measure
Atypical Micro-Cluster • Aggregate the atypical records in one dimension • Summarize the total severity by sensors (sensor/spatial feature) • Summarize the total severity by time window (temporal features) • The size is bounded by the total numbers of sensors and time windows • Still keeping detailed information
Integrate the Micro-clusters • The micro-clusters represent an individual event • Atypical events may happen in similar places/time • For example, 10E highway congested in evening rush hours in weekday • For analytical purposes, it is helpful to group those similar congestions as a whole • Two sub-problems: • Which ones to merge? • How to merge?
Similarity Measure for Atypical Clusters • Basic Principles • Consider the similarity on multiple dimensions – users may specify a preference weight • Weighted measure on the data themselves (e.g., if sensor s1 report higher severities in the clusters than s2, then the weight of s1 is higher) – employ the severity as weight
Cluster Integration • For two clusters C1 and C2, the system • carry out aggregation on the feature of each dimension • for the common items, sum up their severity • keep the non-overlap items • Example • C1 {s1, 100 min; s2, 20 min} • C2 {s1, 30 min; s3, 40 min} • C23{s1, 130 min; s2, 20 min; s3, 40 min} • The spatial and temporal features are algebraic –efficient to aggregate
Macro-Clusters • The macro-clusters are generated by merging the micro-clusters • The similarities are computed among those macro-clusters and even larger ones can be further generated
Clustering Forest • The clusters make up the hierarchy of a tree • Different aggregate paths (preference on dimensions ) form a cluster forest
Outline • Introduction • Backgrounds • Model Construction • Query Processing • Experiments
The Efficiency Problem on Online Query • Usually it is not realistic to materialize the entire data forest • Only some middle results (i.e., the micro-clusters in lower level cells) are pre-computed (Partial materialization) • The time complexity of the cluster integration algorithm is O(n2) • Query efficiency will be influenced if n is large –the analytical query Q(W, T) usually covers large region with long time – n is indeed large
The Effectiveness Problem • In the result, only few significant macro-clusters are generated • The remaining are the trivial ones that cannot be aggregated with others
Pruning-beforehand Strategy • Filter out the insignificant micro-clusters • The insignificant micro-clusters may integrate together and generate significant macro-clusters • Can we foretell which micro-cluster will contribute to significant macro-clusters?
Red-Zone Guided Clustering • Since it is fast to compute the total severity in a specified region • Select out the regions with high severities (red zones) • Filter out the micro-clusters locating outside those red zones • Only keep the ones in/intersect with red zones (where the significant macro-clusters may locate)
Outline • Introduction • Backgrounds • Model Construction • Query Processing • Experiments
Experiment Setup • PeMS datasets from UC Berkeley • 1 year traffic data • 4,076 loop detectors in 38 freeways in California • totally 54 GB • Hardware • Inter 2200 Dual CPU @ 2.20G Hz and 2.19G Hz • 1.98 GB RAM; Windows XP SP2. • All the algorithms are implemented in Java
Model Construction • Comparing Atypical Cluster (AC) with Original CubeView (OC) and Modified CubeView (MC) • AC is an order of magnitude faster than OC
Query Efficieny • All: Do not prune; Pru: Prune beforehand; Gui: Guided Clustering • Gui cost 20% time of All, and is close to Pru
Query Effectiveness • Ground Truth: Generated by All • Pru may miss real significant macro-clusters, but Gui can guarantee the recall
Conclusions • We have investigated the problem of multi-dimensional analysis of atypical events in CPS • Atypical cluster is designed to present the event and serve as the measure for data model • The red-zone algorithm is proposed to retrieve the significant clusters for analytical query • Performance evaluation on real large datasets Thank You Very Much! Any Questions?